
- Title
-
Probing microstructural changes in muscles of leptin-deficient zebrafish by non-invasive ex-vivo magnetic resonance microimaging
- Authors
- Eeza, M.N.H., Singer, R., Ding, Y., He, J., Zuberi, Z., Baelde, H.J., de Groot, H.J.M., Matysik, J., Spaink, H.P., Alia, A.
- Source
- Full text @ PLoS One
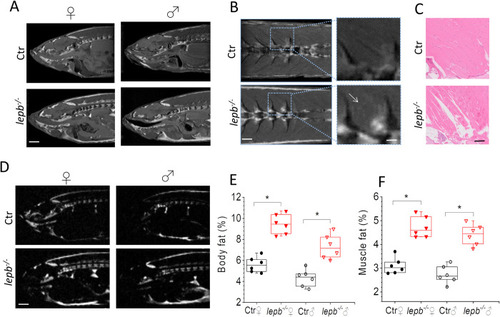
Magnetic resonance anatomical imaging and selective fat imaging in control (Ctr) and lepb-deficient (lepb-/-) adult zebrafish.
(A) Representative sagittal MR images of female (♀) and male (♂) Ctr and lepb-/- zebrafish measured by RARE pulse sequence (TE = 15 ms with effective TE of 33.6 ms; TR = 2000 ms; ns = 8; Scan time 17 min). Scale bar: 1 mm. (B) Representative coronal MR images showing muscle area of female Ctr and lepb-/- zebrafish measured by RARE pulse sequence. Scale bar: 500 μm. A zoomed view (right column) showing fat infiltration in muscles of lepb-/- zebrafish. Scale bar: 250 μm; (C) Histological sections from the same muscle region as in (B) stained with HE staining. Scale bar: 250 μm. (D) Images of fat distribution in the sagittal plane, acquired with Chemical Shift Selective (CHESS) pulse sequence in female Ctr and lepb-/- zebrafish. Scale bar: 1 mm; (E) Quantification of body fat in control and lepb-/- female and male adult zebrafish measured from CHESS MR images (n = 6 per group) (***p < 0.001); (F) Quantification of fat in muscle region from control and lepb-/- female and male adult zebrafish measured from CHESS MR images (n = 6 per group) (***p < 0.001). PHENOTYPE:
|
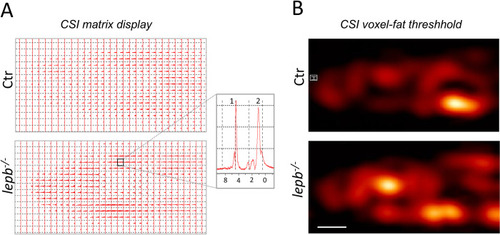
Chemical shift imaging.
(A) Matrix display of chemical shift imaging spectra. CSI data was recorded with a TR = 3500 ms; TE = 15 ms and slice thickness was 2 mm. Total averages were 256. The resolution obtained was 1.25×1.25×2 mm3. The spectral width used was 10 kHz (13.33 ppm) and 32x32 matrix was reconstructed into 64×64 voxels. Inset: Representative spectra of a single voxel showing residual water (1) and fat resonances (2). The main–(CH2)n−signal in muscles is centered around 1.3 ppm, with side lobes from–(CH2)n–CH3 up-field and -CH2-CH = CH-,–CH2–CH2–COOR extending downfield. (B) CSI voxel intensity thresholding. Signals between 0.80 to 1.25 ppm corresponding to fat were chosen to reconstruct CSI images and they were overlaid with corresponding T2-weighted RARE images using the Bruker CSI Visualisation Tool. Scale bar: 1 mm. PHENOTYPE:
|
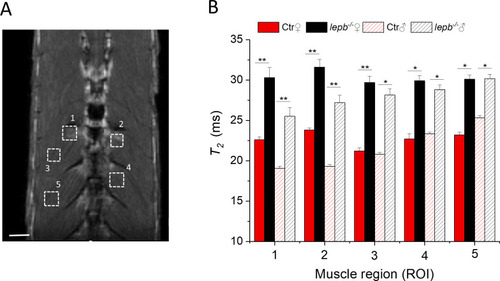
T2 relaxation time measurements in various muscle regions of control (Ctr) and lepb-deficient (lepb-/-) adult zebrafish.
(A) Anatomical T2 –weighted MR coronal slices of an adult zebrafish, showing various muscle regions for T2 measurements. Scale bar, 500 μm. (B) T2 relaxation time values were measured in five different muscle regions of female (♀) and male (♂) control (Ctr) and leptin-deficient (lepb-/-) zebrafish. The reliability test of T2 measurements was performed by Bonferroni test using a 1-way analysis of variance (ANOVA) to accomplish pairwise comparisons of the data. At the 0.05 level, the T2 population means of lepb-/- and Ctr are significantly different for both male and female zebrafish. Data represent the mean T2 in ms ± standard deviation (SD) (Error bars) (95% C.I.); n = 6 per group; *p<0.05, **p<0.01. |
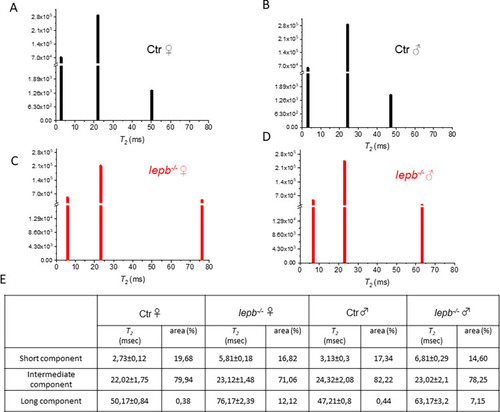
Multicomponent analysis of the experimental T2 relaxation decay curves using a non-negative least square based algorithm (NNLS).
NNLS least-squares spectra of (A) Ctr ♀ (B) Ctr ♂ (C) lepb-/- ♀ and (D) lepb-/- ♂ zebrafish in ROIs located in the fat infiltered muscle area. (E) Time and amplitude of various T2 components (short, intermediate, and long) in msec ± SD and the percentage of areas for each component. |
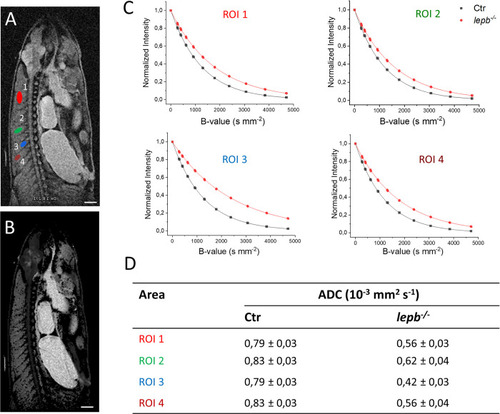
Diffusion-weighted imaging in muscle regions of control (Ctr) and lepb-deficient (lepb-/-) adult zebrafish.
Diffusion measurements were performed using a spin-echo pulse sequence containing a pair of mono-polar diffusion-sensitising gradients (TR, 1000 ms; TE, 60,2 ms; diffusion gradient duration 4 ms and gradient separation of 50 ms; effective B-values range: 221, 267, 399, 614, 914, 1299, 1792, 2385, 3070, 3846, 4714 s/mm2). (A) A diffusion image of control zebrafish showing regions of interest (ROI) located in various muscle regions of adult zebrafish. The first ROI (red) is located in the middle of the upper myotome. The second one (green) covers the middle part of one of the myotomes. The next one (blue) is a smaller region located in the part of the myotome near the spinal cord. The last region (brown), area 0,15 ± 0,01 mm2 is located far from spinal cord (closer to skin). (B) Representative ADC map image of Ctr zebrafish generated through Bruker internal ‘dtraceb’ algorithm. It shows the distribution of ADC values where higher ADC appears bright and lower ADC appears darker. (C) Signal decay curve in respective ROIs is shown in (A). (D) Table of calculated ADC values for regions of interest is shown in (A). Scale bar: 1 mm. |
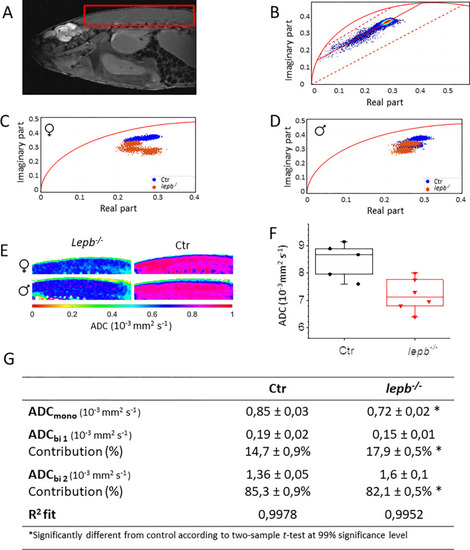
Phasor analysis of multislice 2D quantitative diffusion MRI datasets.
(A) A diffusion image of a leptin-deficient (lepb-/-) zebrafish showing the region of interest (ROI), covering the muscle area. Voxels located outside the zebrafish were removed from the data-set by an intensity threshold. (B) Diffusion data from the ROI was transformed to phasor plot coordinates. Reference mono-component ADC values are located on the semi-circle (curved solid red line), ADC = 0 mm2 s-1 is located at [0, 0] and increases non-linearly clock-wise. General shape indicates a multi-component diffusion system, more specifically a bi-component system. ADC components were determined by line fitting (solid red line) between specified borders (dotted red lines). (C) For smaller ROI’s in the muscle area, phasor coordinates are plotted to compare ADC in female and (D) male lepb-/- zebrafish with respective control (Ctr) zebrafish. (E) Mono-component ADC maps were created for female (♀) and male (♂) lepb-/- and Ctr zebrafish. (F) Quantification of ADCmono in Ctr and lepb-/- zebrafish. (G) Table of calculated ADC values in muscle area. |