
Fig 5
- ID
- ZDB-FIG-230420-37
- Publication
- Eeza et al., 2023 - Probing microstructural changes in muscles of leptin-deficient zebrafish by non-invasive ex-vivo magnetic resonance microimaging
- Other Figures
- All Figure Page
- Back to All Figure Page
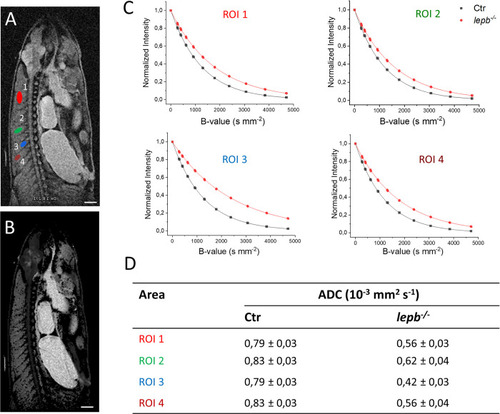
Diffusion-weighted imaging in muscle regions of control (Ctr) and lepb-deficient (lepb-/-) adult zebrafish.
Diffusion measurements were performed using a spin-echo pulse sequence containing a pair of mono-polar diffusion-sensitising gradients (TR, 1000 ms; TE, 60,2 ms; diffusion gradient duration 4 ms and gradient separation of 50 ms; effective B-values range: 221, 267, 399, 614, 914, 1299, 1792, 2385, 3070, 3846, 4714 s/mm2). (A) A diffusion image of control zebrafish showing regions of interest (ROI) located in various muscle regions of adult zebrafish. The first ROI (red) is located in the middle of the upper myotome. The second one (green) covers the middle part of one of the myotomes. The next one (blue) is a smaller region located in the part of the myotome near the spinal cord. The last region (brown), area 0,15 ± 0,01 mm2 is located far from spinal cord (closer to skin). (B) Representative ADC map image of Ctr zebrafish generated through Bruker internal ‘dtraceb’ algorithm. It shows the distribution of ADC values where higher ADC appears bright and lower ADC appears darker. (C) Signal decay curve in respective ROIs is shown in (A). (D) Table of calculated ADC values for regions of interest is shown in (A). Scale bar: 1 mm. |