
Fig 6
- ID
- ZDB-FIG-230420-38
- Publication
- Eeza et al., 2023 - Probing microstructural changes in muscles of leptin-deficient zebrafish by non-invasive ex-vivo magnetic resonance microimaging
- Other Figures
- All Figure Page
- Back to All Figure Page
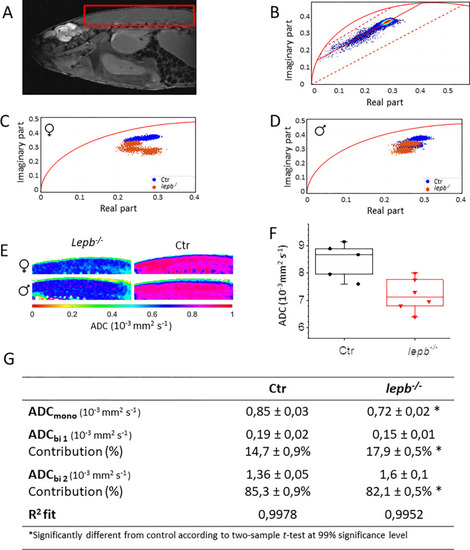
Phasor analysis of multislice 2D quantitative diffusion MRI datasets.
(A) A diffusion image of a leptin-deficient (lepb-/-) zebrafish showing the region of interest (ROI), covering the muscle area. Voxels located outside the zebrafish were removed from the data-set by an intensity threshold. (B) Diffusion data from the ROI was transformed to phasor plot coordinates. Reference mono-component ADC values are located on the semi-circle (curved solid red line), ADC = 0 mm2 s-1 is located at [0, 0] and increases non-linearly clock-wise. General shape indicates a multi-component diffusion system, more specifically a bi-component system. ADC components were determined by line fitting (solid red line) between specified borders (dotted red lines). (C) For smaller ROI’s in the muscle area, phasor coordinates are plotted to compare ADC in female and (D) male lepb-/- zebrafish with respective control (Ctr) zebrafish. (E) Mono-component ADC maps were created for female (♀) and male (♂) lepb-/- and Ctr zebrafish. (F) Quantification of ADCmono in Ctr and lepb-/- zebrafish. (G) Table of calculated ADC values in muscle area. |