
|
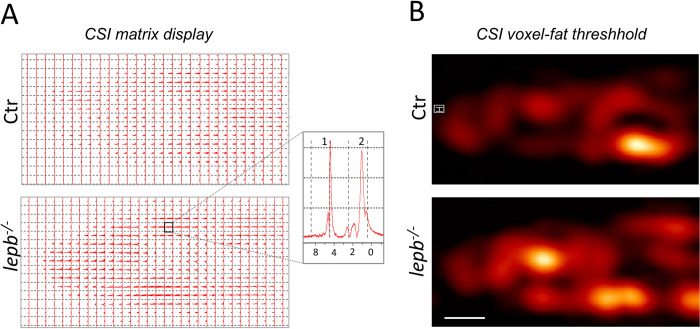
Fig 2
(A) Matrix display of chemical shift imaging spectra. CSI data was recorded with a TR = 3500 ms; TE = 15 ms and slice thickness was 2 mm. Total averages were 256. The resolution obtained was 1.25×1.25×2 mm3. The spectral width used was 10 kHz (13.33 ppm) and 32x32 matrix was reconstructed into 64×64 voxels. Inset: Representative spectra of a single voxel showing residual water (1) and fat resonances (2). The main–(CH2)n−signal in muscles is centered around 1.3 ppm, with side lobes from–(CH2)n–CH3 up-field and -CH2-CH = CH-,–CH2–CH2–COOR extending downfield. (B) CSI voxel intensity thresholding. Signals between 0.80 to 1.25 ppm corresponding to fat were chosen to reconstruct CSI images and they were overlaid with corresponding T2-weighted RARE images using the Bruker CSI Visualisation Tool. Scale bar: 1 mm.