
- Title
-
Deficiency in the cell-adhesion molecule dscaml1 impairs hypothalamic CRH neuron development and perturbs normal neuroendocrine stress axis function
- Authors
- Ma, M., Brunal, A.A., Clark, K.C., Studtmann, C., Stebbins, K., Higashijima, S.I., Pan, Y.A.
- Source
- Full text @ Front Cell Dev Biol
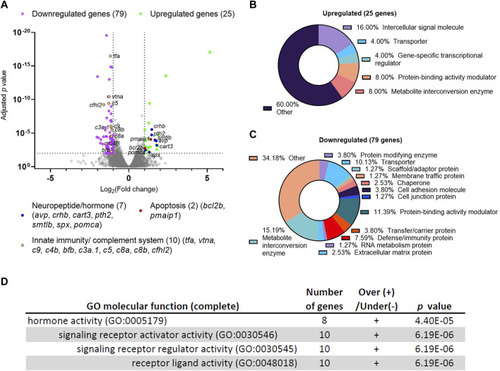
Differential gene expression analysis of dscaml1 deficient zebrafish. (A) Volcano plot of relative gene expression in dscaml1−/− versus control animals. Each dot represents an individual gene, with colored dots representing gene groups as indicated on the graph. The dotted lines show the significance level (adjusted p < 0.01) and fold change (increase or decrease by two-fold or more) thresholds (B, C) Protein class categorization analysis for upregulated (B) and downregulated (C) genes. (D) Table of significantly enriched (p < 0.05) GO terms for molecular function. |
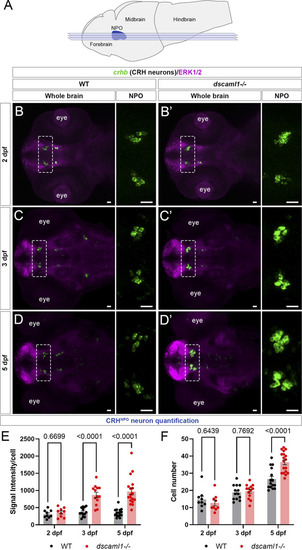
dscaml1 deficiency alters the development of CRHNPO neurons. (A) Illustration of the larval zebrafish brain (lateral view) with rostral to the left. The NPO is highlighted in blue. Imaging planes used for CRHNPO neuron analysis are shown (light blue planes) (B-D') Developmental trajectory of CRHNPO neurons, labeled by crhb FISH (green) and co-stained with anti-ERK1/2 (magenta). At each developmental stage, a representative confocal sub-stack containing the NPO is shown, with the NPO (boxed region) enlarged and shown in the right panel without the ERK1/2 co-stain. Wild-type (WT) animals are shown in panels B, C, and (D) dscaml1−/− animals are shown in panels B', C', and D' (E–F) Quantification of the signal intensity per cell (E) and cell number (F). Multiple-comparison corrected p values are as shown. WT: n = 9 (2 dpf), 13 (3 dpf), 15 (5 dpf). dscaml1−/−: n = 9 (2 dpf), 13 (3 dpf), 18 (5 dpf). Scale bars are 20 μm. Mean, standard error, and corrected p values are shown. |
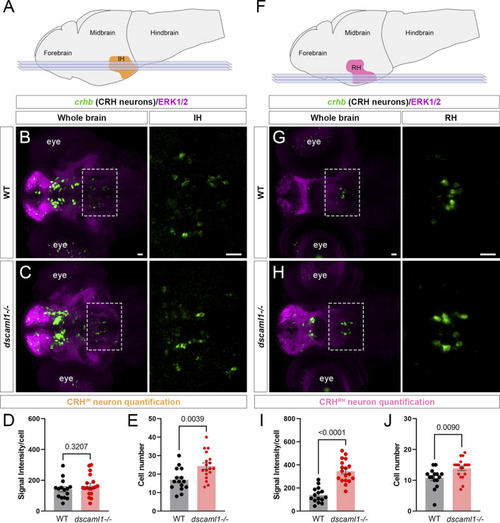
dscaml1 deficiency alters the development of CRH neurons in the intermediate and rostral hypothalamus. (A) Illustration of the larval brain, with the IH highlighted in orange. Imaging planes used for CRHIH neuron analysis are shown (light blue planes). (B, C) Labeling of CRHIH neurons by crhb FISH (green) and co-stained with anti-ERK1/2 (magenta). Representative confocal sub-stacks containing the IH are shown, with the IH (boxed region) enlarged and shown in the right panel without the ERK1/2 co-stain. WT brain is shown in panel B and dscaml1−/− brain is shown in panel C. (D–E) Quantification of the signal intensity per cell (D) and cell number (E). (F) Illustration of the larval brain, with the RH highlighted in pink. Imaging planes used for CRHRH neuron analysis are shown (light blue planes). (G–H) Labeling of CRHRH neurons by crhb FISH (green) and co-stained with anti-ERK1/2 (magenta). Representative confocal sub-stacks containing the RH are shown, with the RH (boxed region) enlarged and shown in the right panel without the ERK1/2 co-stain. WT brain is shown in panel G and dscaml1−/− brain is shown in panel H. (I–J) Quantification of the signal intensity per cell (I) and cell number (J). WT: n = 15. dscaml1−/−: n = 18. Scale bars are 20 μm. Mean, standard error, and p values are shown. |
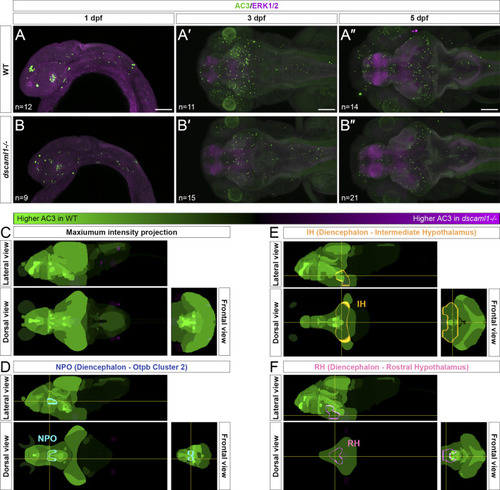
Programmed cell death in the brain is reduced in dscaml1 mutants. (A–B”) Immunolabeling with anti-AC3 (green) and counterstained with anti-ERK1/2 (magenta). 1 dpf embryos are shown laterally, and 3 and 5 dpf larvae dorsally. Wild-type (WT) animals are shown in panels A–A” and dscaml1−/− animals are shown in panels B–B”. (C) 5 dpf Z-Brain mapping of brain regions, showing regions with higher AC3 labeling in WT (green) or dscaml1−/− (magenta). Orthogonal maximum intensity projections are shown. (D) Z-Brain mapping in the NPO. Z-Brain ROI name is indicated in the parenthesis. Orthogonal sections are shown. (E) Z-Brain mapping in the IH. Z-Brain ROI name is indicated in the parenthesis. Orthogonal sections are shown. (F) Z-Brain mapping in the RH. Z-Brain ROI name is indicated in the parenthesis. Orthogonal sections are shown. Anterior is to the left for all images. Scale bars are 100 μm. |
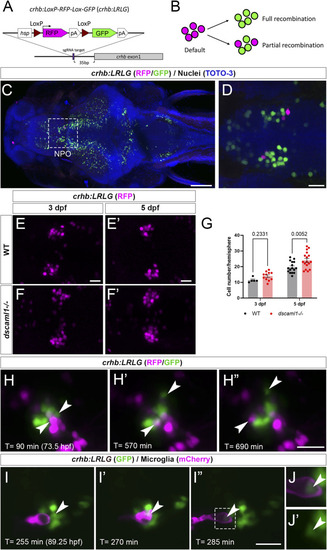
Fluorescent labeling and live imaging of CRHNPO neurons. (A) Schematic of CRISPR -mediated knock-in of the hsp-Lox-RFP-Lox-GFP cassette at the sgRNA target site, located 35 bp upstream of exon 1 of crhb. The orientation and junctional structure of insertion have not been determined. (B) Schematic of crhb:LRLG expression. Each circle represents a fluorescent cell. Without Cre (default), RFP is expressed in all cells. With full recombination, all cells express GFP. Partial recombination results in mosaic RFP and GFP labeling. (C) Dorsal view of a fixed 5 dpf crhb:LRLG larvae with partial recombination stained with anti-RFP (magenta) and anti-GFP (green). The boxed area marks the NPO. (D) Higher magnification image of the NPO. Both RFP and GFP-positive neurons can be seen. (E-F') Images of anti-RFP stained crh:LRLG animals without recombination. Representative WT (E-E') and dscaml1−/− (F-F') NPO neurons are shown. (G) Quantification of RFP-positive cells at 3 and 5 dpf. WT: n = 5 (3 dpf), 16 (5 dpf). dscaml1−/−: n = 11 (3 dpf), 17 (5 dpf). Mean, standard error, and corrected p values are shown. (H–H”) Live crhb:LRLG larvae with partial recombination were imaged from 72 to 84 hpf. Three time points are shown here. Two cells (arrowheads, one green and one magenta) move away over time. (I–I”) Live crhb:LRLG;mpeg1:Gal4;UAS:NTR-mCherry larvae with CRH neurons labeled with GFP (green) and microglia labeled with mCherry (magenta). In this image series, one CRH neuron (arrowhead) is engulfed (I') and then removed (I”) by a microglial cell. Images are confocal optical sections. (J, J') Panels showing enlarged views of the boxed area in (I”), with (J) or without (J') the mCherry channel. The remnant of the CRH neuron can still be seen inside the microglia (arrowheads). Scale bars are 100 μm (panel C) or 20 μm (all other images). |
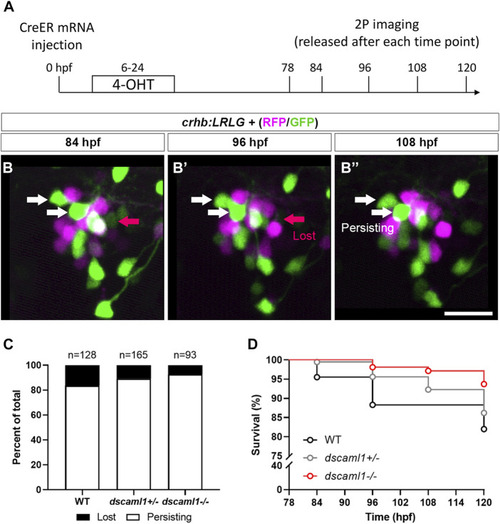
Live tracking of CRHNPO neuron cell fate. (A) Timeline of time-lapse two-photon (2P) imaging experiment. Partial recombination of crhb:LRLG was induced by 4-OHT at 6–24 hpf, and imaging was performed at 78, 84, 96, 108, and 120 hpf. Animals were briefly anesthetized during imaging and allowed to recover in between imaging sessions. (B–B”) Tracking of individual CRHNPO neurons. Three example time frames are shown. Individual fluorescent cells can be tracked over time and are divided into two categories: persisting (white arrows) or lost (pink arrow). The scale bar is 20 μm. (C) Quantification of the percentage of persisting versus lost CRHNPO neurons. Sample size (cell number) as indicated for each genotype. (D) Survival curve of individual CRHNPO neurons in each genotypic group. |
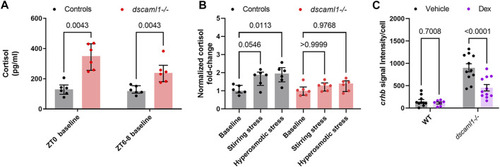
Cortisol levels and response to exogenous glucocorticoids. (A–B) Cortisol profile for 5 dpf larvae. For each sample (dot), cortisol was extracted from a pool of 30 animals. n = 6 for all groups. Median, interquartile range, and corrected p values are shown. (A) Baseline cortisol in control (black) and dscaml1−/− (red) animals. (B) Baseline-normalized cortisol fold change in control (black) and dscaml1−/− (red) animals. (C) Quantification of crhb signal intensity per cell in CRHNPO neurons. Vehicle: n = 10 (WT), 11 (dscaml1−/−). Dex: n = 7 (WT), 11 (dscaml1−/−). Mean, standard error, and corrected p values are shown. |