
FIGURE 6
- ID
- ZDB-FIG-230307-15
- Publication
- Ma et al., 2023 - Deficiency in the cell-adhesion molecule dscaml1 impairs hypothalamic CRH neuron development and perturbs normal neuroendocrine stress axis function
- Other Figures
- All Figure Page
- Back to All Figure Page
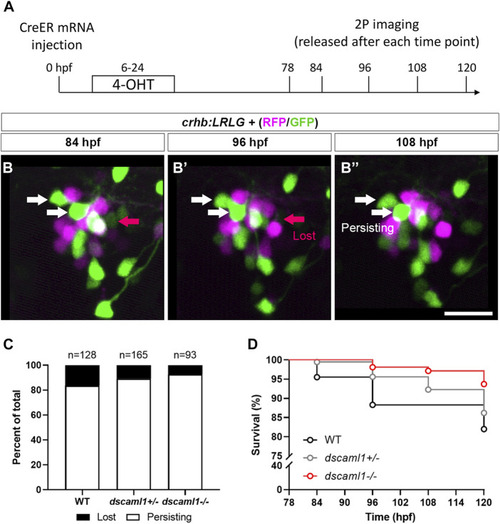
Live tracking of CRHNPO neuron cell fate. (A) Timeline of time-lapse two-photon (2P) imaging experiment. Partial recombination of crhb:LRLG was induced by 4-OHT at 6–24 hpf, and imaging was performed at 78, 84, 96, 108, and 120 hpf. Animals were briefly anesthetized during imaging and allowed to recover in between imaging sessions. (B–B”) Tracking of individual CRHNPO neurons. Three example time frames are shown. Individual fluorescent cells can be tracked over time and are divided into two categories: persisting (white arrows) or lost (pink arrow). The scale bar is 20 μm. (C) Quantification of the percentage of persisting versus lost CRHNPO neurons. Sample size (cell number) as indicated for each genotype. (D) Survival curve of individual CRHNPO neurons in each genotypic group. |