
FIGURE 5
- ID
- ZDB-FIG-230307-14
- Publication
- Ma et al., 2023 - Deficiency in the cell-adhesion molecule dscaml1 impairs hypothalamic CRH neuron development and perturbs normal neuroendocrine stress axis function
- Other Figures
- All Figure Page
- Back to All Figure Page
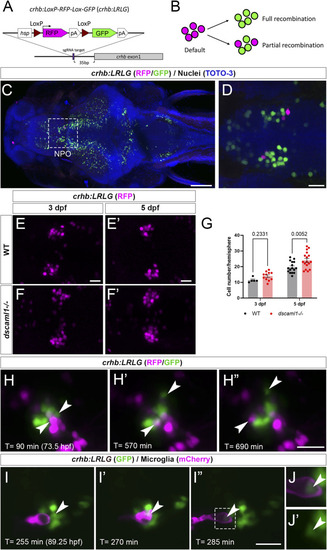
Fluorescent labeling and live imaging of CRHNPO neurons. (A) Schematic of CRISPR -mediated knock-in of the hsp-Lox-RFP-Lox-GFP cassette at the sgRNA target site, located 35 bp upstream of exon 1 of crhb. The orientation and junctional structure of insertion have not been determined. (B) Schematic of crhb:LRLG expression. Each circle represents a fluorescent cell. Without Cre (default), RFP is expressed in all cells. With full recombination, all cells express GFP. Partial recombination results in mosaic RFP and GFP labeling. (C) Dorsal view of a fixed 5 dpf crhb:LRLG larvae with partial recombination stained with anti-RFP (magenta) and anti-GFP (green). The boxed area marks the NPO. (D) Higher magnification image of the NPO. Both RFP and GFP-positive neurons can be seen. (E-F') Images of anti-RFP stained crh:LRLG animals without recombination. Representative WT (E-E') and dscaml1−/− (F-F') NPO neurons are shown. (G) Quantification of RFP-positive cells at 3 and 5 dpf. WT: n = 5 (3 dpf), 16 (5 dpf). dscaml1−/−: n = 11 (3 dpf), 17 (5 dpf). Mean, standard error, and corrected p values are shown. (H–H”) Live crhb:LRLG larvae with partial recombination were imaged from 72 to 84 hpf. Three time points are shown here. Two cells (arrowheads, one green and one magenta) move away over time. (I–I”) Live crhb:LRLG;mpeg1:Gal4;UAS:NTR-mCherry larvae with CRH neurons labeled with GFP (green) and microglia labeled with mCherry (magenta). In this image series, one CRH neuron (arrowhead) is engulfed (I') and then removed (I”) by a microglial cell. Images are confocal optical sections. (J, J') Panels showing enlarged views of the boxed area in (I”), with (J) or without (J') the mCherry channel. The remnant of the CRH neuron can still be seen inside the microglia (arrowheads). Scale bars are 100 μm (panel C) or 20 μm (all other images). |