
Image
|
Figure Caption
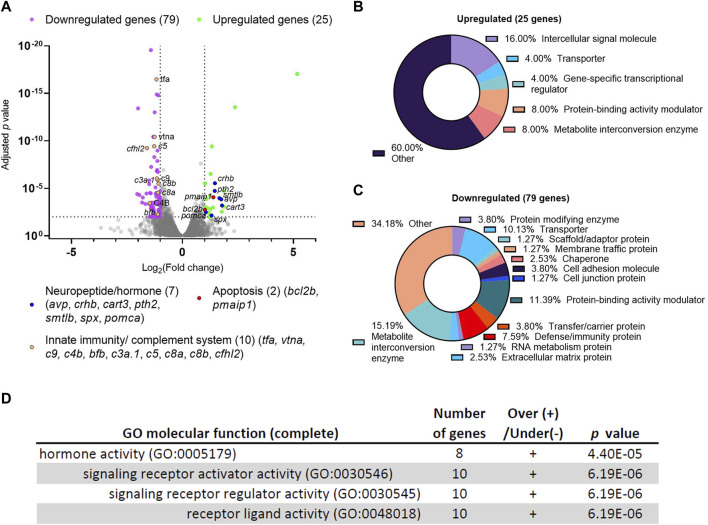
FIGURE 1
Differential gene expression analysis of dscaml1 deficient zebrafish. (A) Volcano plot of relative gene expression in dscaml1−/− versus control animals. Each dot represents an individual gene, with colored dots representing gene groups as indicated on the graph. The dotted lines show the significance level (adjusted p < 0.01) and fold change (increase or decrease by two-fold or more) thresholds (B, C) Protein class categorization analysis for upregulated (B) and downregulated (C) genes. (D) Table of significantly enriched (p < 0.05) GO terms for molecular function.
Acknowledgments
This image is the copyrighted work of the attributed author or publisher, and
ZFIN has permission only to display this image to its users.
Additional permissions should be obtained from the applicable author or publisher of the image.
Full text @ Front Cell Dev Biol