
|
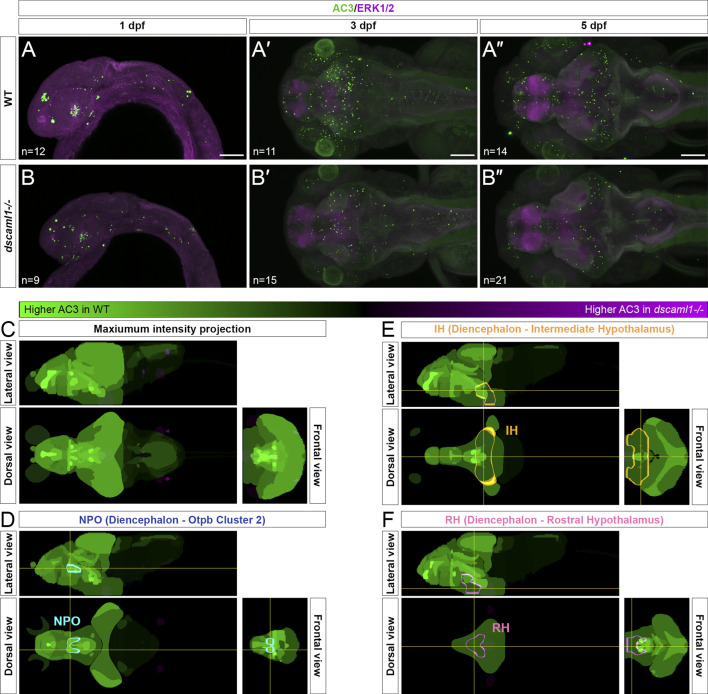
FIGURE 4
Programmed cell death in the brain is reduced in dscaml1 mutants. (A–B”) Immunolabeling with anti-AC3 (green) and counterstained with anti-ERK1/2 (magenta). 1 dpf embryos are shown laterally, and 3 and 5 dpf larvae dorsally. Wild-type (WT) animals are shown in panels A–A” and dscaml1−/− animals are shown in panels B–B”. (C) 5 dpf Z-Brain mapping of brain regions, showing regions with higher AC3 labeling in WT (green) or dscaml1−/− (magenta). Orthogonal maximum intensity projections are shown. (D) Z-Brain mapping in the NPO. Z-Brain ROI name is indicated in the parenthesis. Orthogonal sections are shown. (E) Z-Brain mapping in the IH. Z-Brain ROI name is indicated in the parenthesis. Orthogonal sections are shown. (F) Z-Brain mapping in the RH. Z-Brain ROI name is indicated in the parenthesis. Orthogonal sections are shown. Anterior is to the left for all images. Scale bars are 100 μm.