
- Title
-
Alcam-a and Pdgfr-α are essential for the development of sclerotome-derived stromal cells that support hematopoiesis
- Authors
- Murayama, E., Vivier, C., Schmidt, A., Herbomel, P.
- Source
- Full text @ Nat. Commun.
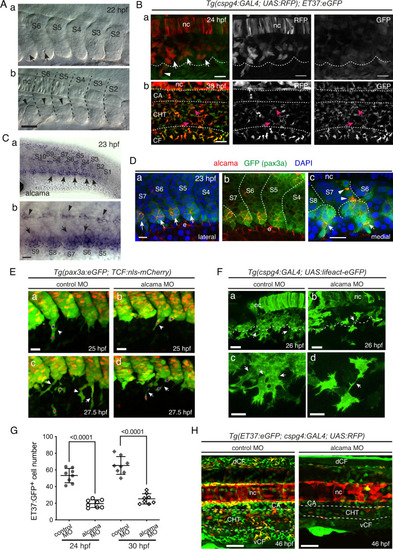
SCP development and requirement for Alcama.
A VE-DIC microscopy of developing caudal somites at 22 hpf, rostral to the left, dorsal to the top. Somites are numbered S2–S6 according to their maturation stage. Lateral (a) and more medial (b) focal planes show the central lumen (a, arrows) formed within the ventral somite clusters, and the dorsal border of the clusters (b, arrowheads). Dashed lines indicate intersomitic boundaries. Scale bar, 40 µm. B Confocal projections of live Tg(cspg4:Gal4; UAS:RFP; ET37:eGFP) embryos at 24 (a) and 38 (b) hpf. a Arrows and arrowhead point at VC cells and an emerging SCP, respectively; the dotted line outlines the ventral border of caudal somites. Magenta arrows in b point at RFP/GFP double-positive cells in the CHT. Scale bars, 20 µm. C WISH for alcama at 23 hpf. Wide-area image of the tail (a) and magnified view of the ventral part of somites S5–S9 (b). Arrows and arrowheads point at somite VCs and cells prefiguring the horizontal myoseptum, respectively; a dotted line outlines the somite ventral border; scale bar, 20 µm. D Immunostaining for Alcama (red), pax3a:eGFP (green), together with DAPI (blue) at 23 hpf. a Overlay of red, blue and green signals; arrows point at Alcama labeling in the somite VCs. b Same image as a without DAPI staining; e epidermis. c At a deeper focal plane, strong Alcama signals were detected at contacts between cells migrating dorsal-wards (arrowheads) and ventral-wards (arrows); dashed lines delineate the VCs and somite borders. Scale bars, 20 µm. E Confocal maximum projections of control or alcama MO-injected Tg(pax3a:eGFP; TCF:nls-mCherry) embryos at 25 (a, b) and 27.5 (c, d) hpf. (a, b) Arrowheads show SCPs beginning to emigrate; magenta and blue asterisks point to the same cells as in (c) and (d), respectively. c, d Arrows point at intercellular junctions of migrating SCPs. n = 12 for each condition from four independent experiments. Scale bars, 25 µm. F Confocal projections of control or alcama MO-injected Tg(cspg4:Gal4; UAS:Lifeact-eGFP) at 26 hpf. Dashed lines indicate the somite ventral borders. Arrows point at connections between migrating SCPs. Magnified images are shown in (c) and (d). n = 9 for each condition from three independent experiments. Scale bars, 20 µm. G Quantification of ET37:eGFP+ cells in the ventral tail of live control and alcama MO-injected embryos, at 24 and 30 hpf over a 5-somites width (n = 8 embryos each; mean ± SD; two-tailed Student’s t-test, Source data are provided as a Source Data file). At 24 hpf, all GFP+ cells ventral to the notochord were counted; at 30 hpf, all GFP+ cells ventral to the somites were counted. H Confocal projections of control or alcama MO-injected Tg(ET37:eGFP; cspg4:Gal4; UAS:RFP) embryos at 46 hpf. Dashed lines delineate the CHT. n = 10 for each condition from a single experiment. Scale bars, 50 µm. nc notochord, CA caudal artery, CHT caudal hematopoietic tissue, vCF and dCF ventral and dorsal caudal fin. |
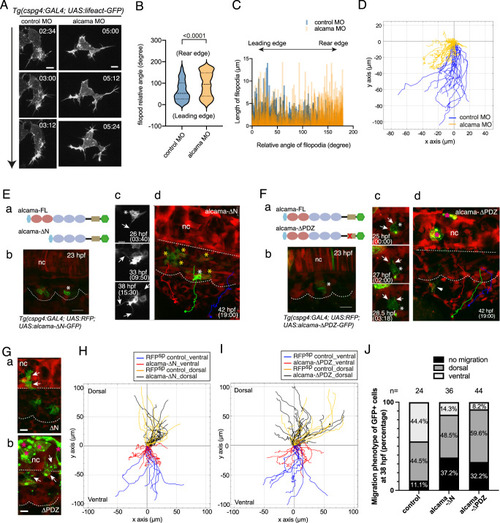
Alcama regulates SCP migration.
A Time-lapse confocal images of a migrating SCP leader cell from control or alcama MO-injected Tg(cspg4:Gal4; UAS:Lifeact-GFP) embryos around 28 hpf. The time after initiation of SCP migration is shown in the upper right corner of each panel. The time lag between control and alcama morphant SCP is because the latter tend to take more time to fully egress from the somite. Arrow indicates the direction of migration. Scale bars, 10 µm. B Violin plot of filopodia angles relative to the direction of migration for leader SCPs in control and alcama morphant embryos (n = 7 SCPs for each group, from 3 independent experiments; median ± SD; two-tailed Mann–Whitney test). C Filopodia length as a function of their relative angles for leader SCPs in control and alcama morphants. D Overlay of individual tracks of control and alcama-deficient SCPs during their migration toward the CHT. (x,y) coordinates of the SCPs’ starting points at somite borders are set to (0,0) and negative or positive values on the y-axis indicate ventral-wards or dorsal-wards migration, respectively. nExp = 4, nembryos = 6, ntracked cells = 19 and 17 for control or alcama morphants, respectively. E, F a Schematic representation of Alcama-FL-eGFP, Alcama-ΔN-eGFP (E-a) and Alcama-ΔPDZ-eGFP (F-a) mutant constructs. Pink and blue ovals indicate the V-type and C2-type Ig-like domains, respectively; the beige rectangle represents the short cytoplasmic domain. In (F-a), the red x indicates the mutated PDZ binding motif. Light blue and green hexagons represent the signal peptide and GFP, respectively. E-b Appearance of Alcama-ΔN-eGFP+ SCPs at 23 hpf. White asterisk indicates the same cell as shown in (E-c, d). Dotted lines delineate somite and notochord borders. Scale bar, 20 µm. c Morphological evolution over 15.5 h of the Alcama-ΔN-eGFP+ SCP shown in (E-b) (see also Supplementary Movie 4). Scale bar, 10 µm. E-d End point of the time-lapse imaging shown in (E-b, c) and Supplementary Movie 4. GFP+ SCPs marked by yellow asterisks did not migrate out of the somites, whereas RFP+/GFP− WT SCPs showed a normal emigration pattern exemplified by the three colored trajectories. A straight dotted line indicates the notochord lower border. F (b) Appearance of Alcama-ΔPDZ-eGFP expressing VC cell (asterisk) at 23 hpf, followed over time in (c) (see also Supplementary Movie 5). Scale bar, 20 µm. c Arrows point at large contact areas between the GFP+ cell and RFP+ cells. d End point of the time-lapse imaging of the same embryo; the GFP+ SCP followed up in (b, c) had disappeared by 42 hpf, while another such cell displayed short-distance migration (arrowhead). RFP+/GFP- (WT) SCPs showed a normal emigration pattern indicated by three colored trajectories. Straight and curvy dashed lines delineate the ventral border of notochord and somites. G Dorsal-wards migration of Alcama-ΔN-eGFP and -ΔPDZ-eGFP expressing cells (arrows) by 27 hpf. Scale bars, 10 µm. Magenta asterisks in (F-d) and (G-b) label GFP+ notochord cells. H Overlay of individual tracks of control (RFP+/GFP− SCPs; orange and blue lines) and Alcama-ΔN-eGFP expressing SCPs (black and red lines). nExp = 5, nembryos = 7, ntracked cells = 29 and 17 for Alcama-ΔN-eGFP+ and control RFP+/GFP− SCPs, respectively. I Overlay of individual tracks of control (RFP+/GFP− SCPs; orange and blue lines) and Alcama-ΔPDZ-eGFP+ SCPs (black and red lines). nExp = 4, nembryos = 5, ntracked cells = 32 and 17 for Alcama-ΔPDZ-eGFP+ and control SCPs, respectively. J Frequency histogram of D/V migration patterns of Alcama-ΔN-eGFP+ and -ΔPDZ-eGFP+ cells compared with GFP+ cells of Tg(cspg4:Gal4;UAS:GFP) embryos at 38 hpf. The number of embryos analyzed was 24 (WT), 36 (Alcama-ΔN), and 44 (Alcama-ΔPDZ) from three independent experiments. nc notochord. Source data for B, C, D H, I, and J are provided as a Source Data file. |
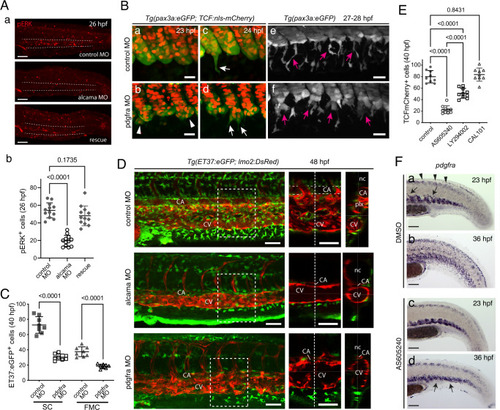
Pdgfr-α/PI3K signaling regulates SCP migration.
A (a) Immunofluorescence for pERK at 26 hpf in the tail region of embryos injected with control MO, alcama MO, or alcama MO + alcama mRNA (“rescue”); n = 12 embryos from two independent experiments. Dashed lines indicate the CHT border. b Quantification of a (n = 12 embryos for each group; mean ± SD; one-way ANOVA followed by Dunnett’s multiple comparison test). B Confocal projections of live control (a, c, e) or pdgfra (b, d, f) MO-injected Tg(ET37:eGFP; TCF:nls-mCherry) embryos from 23 to 28 hpf. Arrowheads point at cohesion defects observed in the VCs of pdgfra MO-injected embryos. White and magenta arrows indicate emerging (c, d) and migrating (e, f) SCPs, respectively; n = 9 for each condition from three independent experiments. Scale bars, 25 µm. C Quantification of ET37:eGFP+ stromal cells and FMCs in control and pdgfra MO-injected embryos at 40 hpf (n = 8 for each group, from the same experiment; mean ± SD; two-tailed Student’s t-test). D Confocal maximum projections of control, alcama, and pdgfra MO-injected Tg(ET37:eGFP; lmo2:DsRed) embryos at 48 hpf. An enlarged view of the area enclosed by the dashed square is shown in the middle panel (single slice image), where a dotted vertical line shows the position of the orthogonal projection (transverse section) shown in the right panel; n = 6 for each condition from three independent experiments. Scale bars, 50 µm. E Quantification of TCF:nls-mCherry+ stromal cells in the CHT of control embryos (n = 9), or embryos treated from 20 hpf with AS605240 (n = 10), LY294002 (n = 10), or CAL101 (n = 9) at 40 hpf (mean ± SD; one-way ANOVA followed by Tukey’s multiple comparison test). F WISH for pdgfra at 23 and 36 hpf in 0.2% DMSO (control) and AS605240-treated embryos. Arrows and arrowheads in (a) indicate VC cells migrating toward the notochord and dorsal mesenchymal cells at 23 hpf, respectively. Arrows in d show SCPs slightly dispersed around the VCs at 36 hpf. n = 12 for each condition from two independent experiments. CA caudal artery, CV definitive caudal vein, Plx venous plexus, nc notochord. Source data for A-b, C, and E are provided as a Source Data file. |
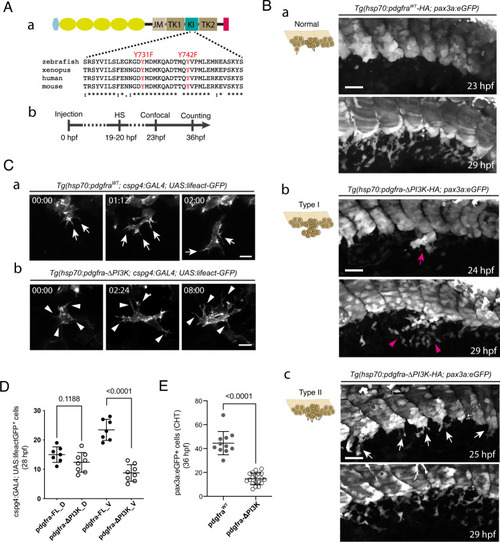
Pdgfr-α influences cluster cohesion and SCP migration behavior through PI3K binding.
A (a) Schematic representation of Pdgfra fused to tandem HA-tag (red) at its C-terminus, and amino acid alignment around the site of mutations in the KI (kinase insert) domain. The light blue hexagon and yellow ovals indicate the signal peptide and Ig-like extracellular domains, respectively; JM juxtamembrane, TK1 tyrosine kinase domain 1, TK2 tyrosine kinase domain 2, tyrosine residues involved in PI3K binding when phosphorylated that we mutated into phenylalanines are shown in red. b Time course of the experiment; HS, heat-shock. B Confocal projections at 23 and 29 hpf of live Tg(pax3a:eGFP)embryos injected with hsp70:pdgfraWT-HA (a) or hsp70:pdgfra-ΔPI3K construct (b, c) and heat-shocked at 19-20 hpf; Tg(hsp70:pdgfra-ΔPI3K; pax3a:eGFP) embryos show defects in VC cohesion (type I, b) or SCP emergence and migration (type II, c) (see also Supplementary Fig. 4B). Arrow in b indicates SCPs overflow out of the cluster before migration initiation. This cell population was dispersed locally after 5 hrs (arrowheads). c, Arrows indicate multiple SCPs emerging simultaneously from the cluster; n = 29 (a), 7 (b), and 13 (c) for each condition from 9 independent experiments. Scale bars, 40 µm. C Representative frames of a confocal time-lapse sequence starting at 23 hpf of a migrating SCP leader cell in Tg(cspg4:GAL4; UAS:lifeact-eGFP) embryo injected with the hsp70:pdgfra-FL (a) or hsp70:pdgfra-ΔPI3K (b) construct. Time is indicated in hrs and min. Arrows in a indicate filopodia projected in the direction of migration; arrowheads in b indicate filopodia in all directions. Scale bars, 25 µm. D Quantification of Tg(cspg4:Gal4; UAS:lifeact-eGFP+) SCPs migrating dorsal-wards (D) or ventral-wards (V) in Pdgfra-FL (control) and Pdgfra-ΔPI3K expressing embryos at 28 hpf (n = 7 and 8 embryos for control and hsp70:pdgfra-ΔPI3K, respectively, from 3 independent experiments. mean ± SD; two-tailed Student’s t-test. E Counting of pax3a:eGFP+ SCPs in control and hsp70:pdgfra-ΔPI3K embryos in the CHT at 36 hpf over a 5-somite width (n = 11 and 19 embryos for control and hsp70:pdgfra-ΔPI3K, respectively, from 3 independent experiments). mean ± SD; two-tailed Student’s t-test. Source data for D and E are provided as a Source Data file. |
Somite VCs coincide with the sclerotome.
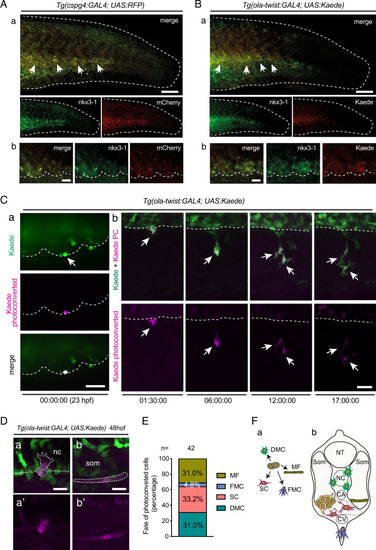
A, B Tg(cspg4:Gal4; UAS:RFP) embryos (A) and Tg(ola-twist:Gal4; UAS:Kaede) embryos (B) were fixed at 24 hpf and subjected to double fluorescence WISH using probes for nkx3.1 and mCherry or Kaede mRNA, respectively. The entire tail area (a) and magnified images of the VCs (b) are shown; dashed line and arrows in a indicate the border of the caudal region and VC cells showing double staining. Dashed lines in b delineate the VC ventral borders. Scale bars, 100 µm in (a) and 20 µm in (b). C Confocal images of a live Tg(ola-twist:Gal4; UAS:Kaede) embryo. a a single Kaede(green)+ cell at the ventral border of an anterior caudal somite was photoconverted (magenta) at 23 hpf. b Representative frames from a time-lapse follow-up of the Kaede+ cell photoconverted in (a), which underwent mitosis at 10h15 ( |
alcama and pdgfra are regulated by sclerotome-associated TFs.
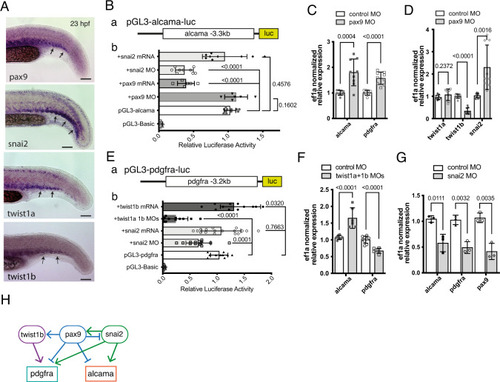
A WISH for pax9, snail2, twist1a, and twist1b at 23 hpf in the tail of WT embryos. Arrows point to expression of these genes in the somitic VCs. B (a) a DNA fragment encompassing 3.3 kb upstream of the alcama gene transcription start site was inserted upstream of the luciferase (luc) coding region of the pGL3-Basic plasmid, to give pGL3-alcama-luc. b In situ luciferase assays at 23 hpf following pGL3-alcama-luc injection at the 1-cell stage either alone or together with the indicated mRNA or MO; each lysate was obtained from 10 to 15 tails (n = 9 lysates for each condition, as biological triplicates from three independent experiments) or pax9 (n = 6 for each). The pGL3-Basic and pGL3-alcama-luc (n = 11 for each) were used as negative and positive controls, respectively (mean ± SD; one-way ANOVA followed by Dunnett’s multiple comparison test). C qPCR analysis for alcama and pdgfra in pax9 morphants and control (n = 9 pooled tail samples for each, a set of biological triplicates from three independent experiments) at 23 hpf. mean ± SD; two-tailed Student’s t-test. D qPCR analysis for twist1a, twist1b, and snai2 in pax9 morphants and control (n = 9 pooled tail samples for each, measured examined over three independent experiments) at 23 hpf. mean ± SD; two-tailed Student’s t-test. E (a) a DNA fragment covering 3.2 kb upstream of the pdgfra gene transcription start site was inserted upstream of the luciferase (luc) coding region to give pGL3-pdgfra-luc. b Same experimental scheme as in B-b, following injection of the indicated constructs and MO or mRNA combinations (n = 12, 11, 17, and 14 lysates for twist1b mRNA, twist1a 1b MOs, snai2 mRNA and snai2 MO examined over three independent experiments). mean ± SD; One-way ANOVA followed by Dunnett’s multiple comparison test. (F) qPCR analysis for alcama and pdgfra (n = 6 pooled tail samples for each, measured examined over two independent experiments) in twist1a/twist1b double morphants and control at 23 hpf. Mean ± SD; two-tailed Student’s t-test. G qPCR analysis for alcama, pdgfra, and pax9 in snai2 morphants and control (n = 3) at 23 hpf (mean ± SD; two-tailed Student’s t-test). H Proposed network of TFs acting on alcama and pdgfra during SCP development; lines ending with arrow or bar represent activation or repression, respectively. Source data for B–G are provided as a Source Data file. |
Alcama and Pdgfr-α are also involved in stromal cell development in the trunk, which conditions the development of definitive HSPCs.
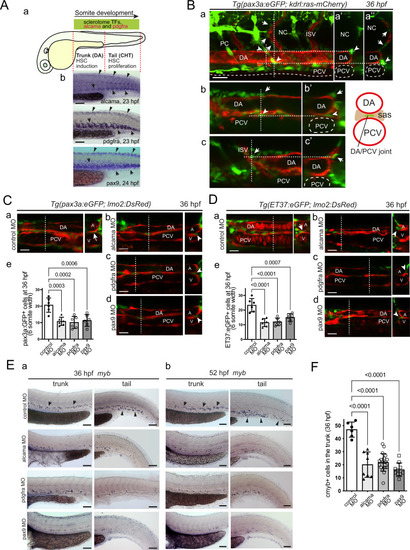
A (a) Rostro-caudal extent of sclerotomal TFs and alcama and pdgfra expression by 24 hpf. b WISH for alcama, pdgfra, and pax9 at 23–24 hpf. Arrows point at their expression in the somite VCs/sclerotome in the trunk and tail. Arrowheads point at their expression in the smaller dorsal sclerotome15. B Confocal maximum projection (a) and single confocal sections (b, c) of the trunk region of a Tg(pax3a:eGFP; kdrl:ras-mCherry) embryo at 36 hpf, with vertical dashed lines showing the position of the optical transverse sections shown on the right (a’, a”, b’, c’). Arrowheads point at GFP+ stromal cells located at the DA/notochord or DA/PCV junction, arrows point at ISV-associated mesenchymal cells, known to originate from the dorsal-wards migration of ventral sclerotome cells12,15. Scale bar, 20 µm. C, D Confocal sections of the trunk region of Tg(pax3a:eGFP; lmo2:DsRed) (C) and Tg(ET37:eGFP; lmo2:DsRed) (D) embryos injected with control (a), alcama (b), pdgfra (c), or pax9 (d) MOs. Dashed lines indicate the position of the corresponding transverse section shown on the right. Arrows and arrowheads point at stromal cells located at the DA/PCV joint or somewhat lateral to it, respectively. e Quantification of pax3a:eGFP+ (C) or ET37:eGFP+ (D) cells in the sub-aortic space of 36 hpf live embryos injected with control, alcama, pdgfra or pax9 MO (mean ± SD; n = 6 embryos for each group. One-way ANOVA followed by Dunnett’s multiple comparison test). Counting was done over a 6-somite width. Scale bars, 20 µm. E WISH for myb at 36 (a) and 52 (b) hpf in embryos injected with control, alcama, pdgfra, or pax9 MO. Arrows and arrowheads point at myb+ signals in the trunk (arrows) and tail (arrowheads) regions, respectively. a Representative images of n = 6, 8, 20, and 10 injected embryos for control, alcama, pdgfra, and pax9 MO, respectively, from two independent experiments. b Representative images of n = 6 for each condition, from two independent experiments. Scale bars, 100 µm. F Quantification of myb+ cells at 36 hpf as shown in (E-a) (mean ± SD; n = 6 embryos for control, 8 for alcama, 20 for pdgfra, and 10 for pax9 MO-injected embryos. One-way ANOVA followed by Dunnett’s multiple comparison test). DA or A dorsal aorta, PCV or V posterior cardinal vein, ISV intersomitic vessel, sas sub-aortic space. Source data for C-e, D-e, and F are provided as a Source Data file. |