
Fig. 6
- ID
- ZDB-FIG-230305-88
- Publication
- Murayama et al., 2023 - Alcam-a and Pdgfr-α are essential for the development of sclerotome-derived stromal cells that support hematopoiesis
- Other Figures
- All Figure Page
- Back to All Figure Page
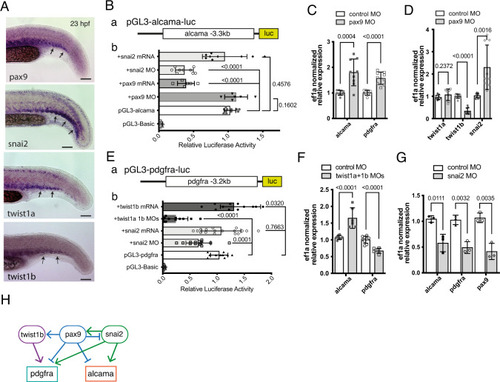
alcama and pdgfra are regulated by sclerotome-associated TFs.
A WISH for pax9, snail2, twist1a, and twist1b at 23 hpf in the tail of WT embryos. Arrows point to expression of these genes in the somitic VCs. B (a) a DNA fragment encompassing 3.3 kb upstream of the alcama gene transcription start site was inserted upstream of the luciferase (luc) coding region of the pGL3-Basic plasmid, to give pGL3-alcama-luc. b In situ luciferase assays at 23 hpf following pGL3-alcama-luc injection at the 1-cell stage either alone or together with the indicated mRNA or MO; each lysate was obtained from 10 to 15 tails (n = 9 lysates for each condition, as biological triplicates from three independent experiments) or pax9 (n = 6 for each). The pGL3-Basic and pGL3-alcama-luc (n = 11 for each) were used as negative and positive controls, respectively (mean ± SD; one-way ANOVA followed by Dunnett’s multiple comparison test). C qPCR analysis for alcama and pdgfra in pax9 morphants and control (n = 9 pooled tail samples for each, a set of biological triplicates from three independent experiments) at 23 hpf. mean ± SD; two-tailed Student’s t-test. D qPCR analysis for twist1a, twist1b, and snai2 in pax9 morphants and control (n = 9 pooled tail samples for each, measured examined over three independent experiments) at 23 hpf. mean ± SD; two-tailed Student’s t-test. E (a) a DNA fragment covering 3.2 kb upstream of the pdgfra gene transcription start site was inserted upstream of the luciferase (luc) coding region to give pGL3-pdgfra-luc. b Same experimental scheme as in B-b, following injection of the indicated constructs and MO or mRNA combinations (n = 12, 11, 17, and 14 lysates for twist1b mRNA, twist1a 1b MOs, snai2 mRNA and snai2 MO examined over three independent experiments). mean ± SD; One-way ANOVA followed by Dunnett’s multiple comparison test. (F) qPCR analysis for alcama and pdgfra (n = 6 pooled tail samples for each, measured examined over two independent experiments) in twist1a/twist1b double morphants and control at 23 hpf. Mean ± SD; two-tailed Student’s t-test. G qPCR analysis for alcama, pdgfra, and pax9 in snai2 morphants and control (n = 3) at 23 hpf (mean ± SD; two-tailed Student’s t-test). H Proposed network of TFs acting on alcama and pdgfra during SCP development; lines ending with arrow or bar represent activation or repression, respectively. Source data for B–G are provided as a Source Data file. |