
Fig. 7
- ID
- ZDB-FIG-230305-89
- Publication
- Murayama et al., 2023 - Alcam-a and Pdgfr-α are essential for the development of sclerotome-derived stromal cells that support hematopoiesis
- Other Figures
- All Figure Page
- Back to All Figure Page
Alcama and Pdgfr-α are also involved in stromal cell development in the trunk, which conditions the development of definitive HSPCs.
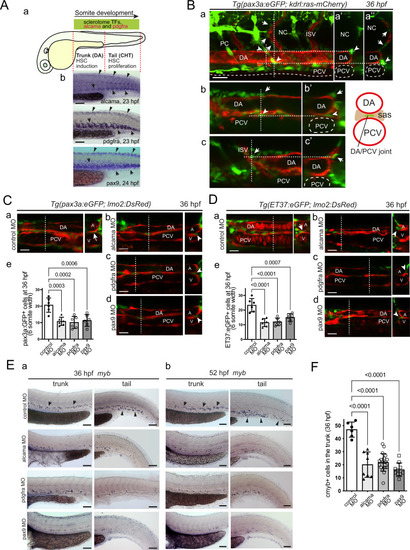
A (a) Rostro-caudal extent of sclerotomal TFs and alcama and pdgfra expression by 24 hpf. b WISH for alcama, pdgfra, and pax9 at 23–24 hpf. Arrows point at their expression in the somite VCs/sclerotome in the trunk and tail. Arrowheads point at their expression in the smaller dorsal sclerotome15. B Confocal maximum projection (a) and single confocal sections (b, c) of the trunk region of a Tg(pax3a:eGFP; kdrl:ras-mCherry) embryo at 36 hpf, with vertical dashed lines showing the position of the optical transverse sections shown on the right (a’, a”, b’, c’). Arrowheads point at GFP+ stromal cells located at the DA/notochord or DA/PCV junction, arrows point at ISV-associated mesenchymal cells, known to originate from the dorsal-wards migration of ventral sclerotome cells12,15. Scale bar, 20 µm. C, D Confocal sections of the trunk region of Tg(pax3a:eGFP; lmo2:DsRed) (C) and Tg(ET37:eGFP; lmo2:DsRed) (D) embryos injected with control (a), alcama (b), pdgfra (c), or pax9 (d) MOs. Dashed lines indicate the position of the corresponding transverse section shown on the right. Arrows and arrowheads point at stromal cells located at the DA/PCV joint or somewhat lateral to it, respectively. e Quantification of pax3a:eGFP+ (C) or ET37:eGFP+ (D) cells in the sub-aortic space of 36 hpf live embryos injected with control, alcama, pdgfra or pax9 MO (mean ± SD; n = 6 embryos for each group. One-way ANOVA followed by Dunnett’s multiple comparison test). Counting was done over a 6-somite width. Scale bars, 20 µm. E WISH for myb at 36 (a) and 52 (b) hpf in embryos injected with control, alcama, pdgfra, or pax9 MO. Arrows and arrowheads point at myb+ signals in the trunk (arrows) and tail (arrowheads) regions, respectively. a Representative images of n = 6, 8, 20, and 10 injected embryos for control, alcama, pdgfra, and pax9 MO, respectively, from two independent experiments. b Representative images of n = 6 for each condition, from two independent experiments. Scale bars, 100 µm. F Quantification of myb+ cells at 36 hpf as shown in (E-a) (mean ± SD; n = 6 embryos for control, 8 for alcama, 20 for pdgfra, and 10 for pax9 MO-injected embryos. One-way ANOVA followed by Dunnett’s multiple comparison test). DA or A dorsal aorta, PCV or V posterior cardinal vein, ISV intersomitic vessel, sas sub-aortic space. Source data for C-e, D-e, and F are provided as a Source Data file. |