
Fig. 4
- ID
- ZDB-FIG-230305-87
- Publication
- Murayama et al., 2023 - Alcam-a and Pdgfr-α are essential for the development of sclerotome-derived stromal cells that support hematopoiesis
- Other Figures
- All Figure Page
- Back to All Figure Page
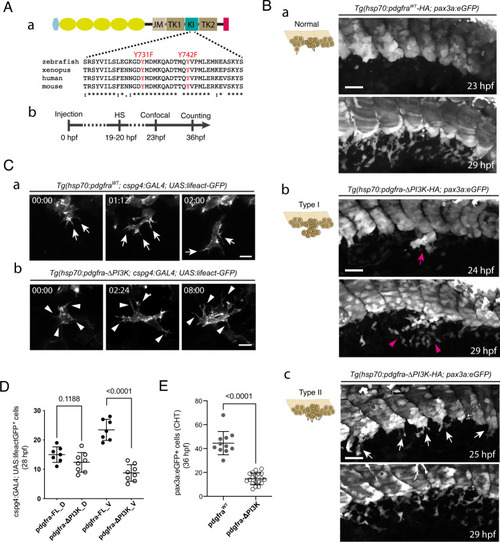
Pdgfr-α influences cluster cohesion and SCP migration behavior through PI3K binding.
A (a) Schematic representation of Pdgfra fused to tandem HA-tag (red) at its C-terminus, and amino acid alignment around the site of mutations in the KI (kinase insert) domain. The light blue hexagon and yellow ovals indicate the signal peptide and Ig-like extracellular domains, respectively; JM juxtamembrane, TK1 tyrosine kinase domain 1, TK2 tyrosine kinase domain 2, tyrosine residues involved in PI3K binding when phosphorylated that we mutated into phenylalanines are shown in red. b Time course of the experiment; HS, heat-shock. B Confocal projections at 23 and 29 hpf of live Tg(pax3a:eGFP)embryos injected with hsp70:pdgfraWT-HA (a) or hsp70:pdgfra-ΔPI3K construct (b, c) and heat-shocked at 19-20 hpf; Tg(hsp70:pdgfra-ΔPI3K; pax3a:eGFP) embryos show defects in VC cohesion (type I, b) or SCP emergence and migration (type II, c) (see also Supplementary Fig. 4B). Arrow in b indicates SCPs overflow out of the cluster before migration initiation. This cell population was dispersed locally after 5 hrs (arrowheads). c, Arrows indicate multiple SCPs emerging simultaneously from the cluster; n = 29 (a), 7 (b), and 13 (c) for each condition from 9 independent experiments. Scale bars, 40 µm. C Representative frames of a confocal time-lapse sequence starting at 23 hpf of a migrating SCP leader cell in Tg(cspg4:GAL4; UAS:lifeact-eGFP) embryo injected with the hsp70:pdgfra-FL (a) or hsp70:pdgfra-ΔPI3K (b) construct. Time is indicated in hrs and min. Arrows in a indicate filopodia projected in the direction of migration; arrowheads in b indicate filopodia in all directions. Scale bars, 25 µm. D Quantification of Tg(cspg4:Gal4; UAS:lifeact-eGFP+) SCPs migrating dorsal-wards (D) or ventral-wards (V) in Pdgfra-FL (control) and Pdgfra-ΔPI3K expressing embryos at 28 hpf (n = 7 and 8 embryos for control and hsp70:pdgfra-ΔPI3K, respectively, from 3 independent experiments. mean ± SD; two-tailed Student’s t-test. E Counting of pax3a:eGFP+ SCPs in control and hsp70:pdgfra-ΔPI3K embryos in the CHT at 36 hpf over a 5-somite width (n = 11 and 19 embryos for control and hsp70:pdgfra-ΔPI3K, respectively, from 3 independent experiments). mean ± SD; two-tailed Student’s t-test. Source data for D and E are provided as a Source Data file. |