
Fig. 1
- ID
- ZDB-FIG-230305-84
- Publication
- Murayama et al., 2023 - Alcam-a and Pdgfr-α are essential for the development of sclerotome-derived stromal cells that support hematopoiesis
- Other Figures
- All Figure Page
- Back to All Figure Page
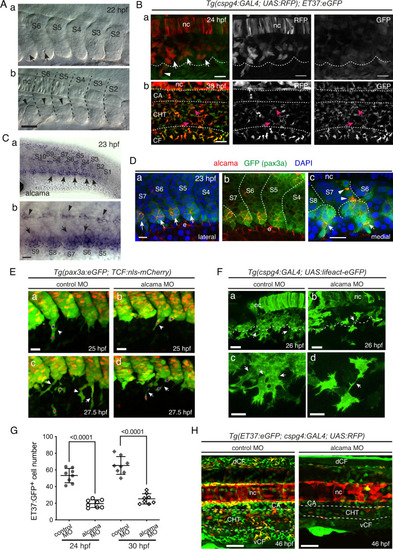
SCP development and requirement for Alcama.
A VE-DIC microscopy of developing caudal somites at 22 hpf, rostral to the left, dorsal to the top. Somites are numbered S2–S6 according to their maturation stage. Lateral (a) and more medial (b) focal planes show the central lumen (a, arrows) formed within the ventral somite clusters, and the dorsal border of the clusters (b, arrowheads). Dashed lines indicate intersomitic boundaries. Scale bar, 40 µm. B Confocal projections of live Tg(cspg4:Gal4; UAS:RFP; ET37:eGFP) embryos at 24 (a) and 38 (b) hpf. a Arrows and arrowhead point at VC cells and an emerging SCP, respectively; the dotted line outlines the ventral border of caudal somites. Magenta arrows in b point at RFP/GFP double-positive cells in the CHT. Scale bars, 20 µm. C WISH for alcama at 23 hpf. Wide-area image of the tail (a) and magnified view of the ventral part of somites S5–S9 (b). Arrows and arrowheads point at somite VCs and cells prefiguring the horizontal myoseptum, respectively; a dotted line outlines the somite ventral border; scale bar, 20 µm. D Immunostaining for Alcama (red), pax3a:eGFP (green), together with DAPI (blue) at 23 hpf. a Overlay of red, blue and green signals; arrows point at Alcama labeling in the somite VCs. b Same image as a without DAPI staining; e epidermis. c At a deeper focal plane, strong Alcama signals were detected at contacts between cells migrating dorsal-wards (arrowheads) and ventral-wards (arrows); dashed lines delineate the VCs and somite borders. Scale bars, 20 µm. E Confocal maximum projections of control or alcama MO-injected Tg(pax3a:eGFP; TCF:nls-mCherry) embryos at 25 (a, b) and 27.5 (c, d) hpf. (a, b) Arrowheads show SCPs beginning to emigrate; magenta and blue asterisks point to the same cells as in (c) and (d), respectively. c, d Arrows point at intercellular junctions of migrating SCPs. n = 12 for each condition from four independent experiments. Scale bars, 25 µm. F Confocal projections of control or alcama MO-injected Tg(cspg4:Gal4; UAS:Lifeact-eGFP) at 26 hpf. Dashed lines indicate the somite ventral borders. Arrows point at connections between migrating SCPs. Magnified images are shown in (c) and (d). n = 9 for each condition from three independent experiments. Scale bars, 20 µm. G Quantification of ET37:eGFP+ cells in the ventral tail of live control and alcama MO-injected embryos, at 24 and 30 hpf over a 5-somites width (n = 8 embryos each; mean ± SD; two-tailed Student’s t-test, Source data are provided as a Source Data file). At 24 hpf, all GFP+ cells ventral to the notochord were counted; at 30 hpf, all GFP+ cells ventral to the somites were counted. H Confocal projections of control or alcama MO-injected Tg(ET37:eGFP; cspg4:Gal4; UAS:RFP) embryos at 46 hpf. Dashed lines delineate the CHT. n = 10 for each condition from a single experiment. Scale bars, 50 µm. nc notochord, CA caudal artery, CHT caudal hematopoietic tissue, vCF and dCF ventral and dorsal caudal fin. |