
|
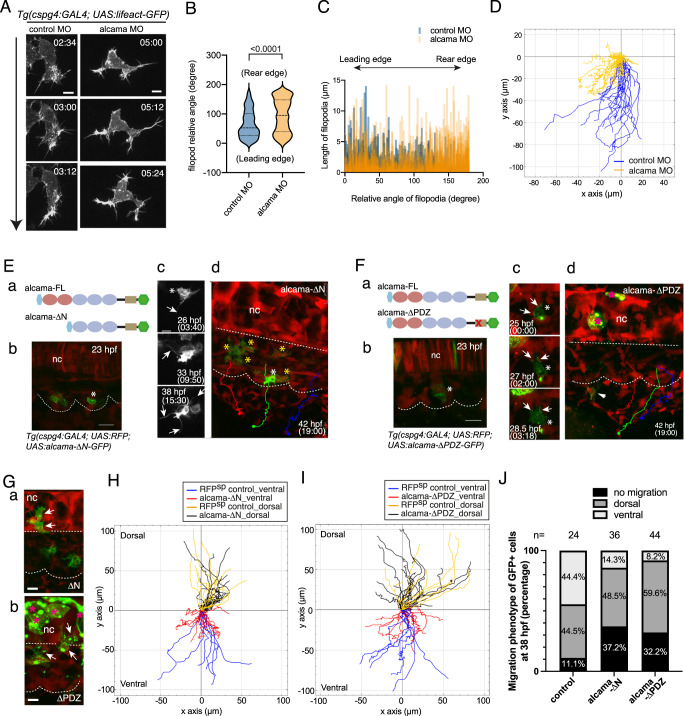
Fig. 2
A Time-lapse confocal images of a migrating SCP leader cell from control or alcama MO-injected Tg(cspg4:Gal4; UAS:Lifeact-GFP) embryos around 28 hpf. The time after initiation of SCP migration is shown in the upper right corner of each panel. The time lag between control and alcama morphant SCP is because the latter tend to take more time to fully egress from the somite. Arrow indicates the direction of migration. Scale bars, 10 µm. B Violin plot of filopodia angles relative to the direction of migration for leader SCPs in control and alcama morphant embryos (n = 7 SCPs for each group, from 3 independent experiments; median ± SD; two-tailed Mann–Whitney test). C Filopodia length as a function of their relative angles for leader SCPs in control and alcama morphants. D Overlay of individual tracks of control and alcama-deficient SCPs during their migration toward the CHT. (x,y) coordinates of the SCPs’ starting points at somite borders are set to (0,0) and negative or positive values on the y-axis indicate ventral-wards or dorsal-wards migration, respectively. nExp = 4, nembryos = 6, ntracked cells = 19 and 17 for control or alcama morphants, respectively. E, F a Schematic representation of Alcama-FL-eGFP, Alcama-ΔN-eGFP (E-a) and Alcama-ΔPDZ-eGFP (F-a) mutant constructs. Pink and blue ovals indicate the V-type and C2-type Ig-like domains, respectively; the beige rectangle represents the short cytoplasmic domain. In (F-a), the red x indicates the mutated PDZ binding motif. Light blue and green hexagons represent the signal peptide and GFP, respectively. E-b Appearance of Alcama-ΔN-eGFP+ SCPs at 23 hpf. White asterisk indicates the same cell as shown in (E-c, d). Dotted lines delineate somite and notochord borders. Scale bar, 20 µm. c Morphological evolution over 15.5 h of the Alcama-ΔN-eGFP+ SCP shown in (E-b) (see also Supplementary Movie 4). Scale bar, 10 µm. E-d End point of the time-lapse imaging shown in (E-b, c) and Supplementary Movie 4. GFP+ SCPs marked by yellow asterisks did not migrate out of the somites, whereas RFP+/GFP− WT SCPs showed a normal emigration pattern exemplified by the three colored trajectories. A straight dotted line indicates the notochord lower border. F (b) Appearance of Alcama-ΔPDZ-eGFP expressing VC cell (asterisk) at 23 hpf, followed over time in (c) (see also Supplementary Movie 5). Scale bar, 20 µm. c Arrows point at large contact areas between the GFP+ cell and RFP+ cells. d End point of the time-lapse imaging of the same embryo; the GFP+ SCP followed up in (b, c) had disappeared by 42 hpf, while another such cell displayed short-distance migration (arrowhead). RFP+/GFP- (WT) SCPs showed a normal emigration pattern indicated by three colored trajectories. Straight and curvy dashed lines delineate the ventral border of notochord and somites. G Dorsal-wards migration of Alcama-ΔN-eGFP and -ΔPDZ-eGFP expressing cells (arrows) by 27 hpf. Scale bars, 10 µm. Magenta asterisks in (F-d) and (G-b) label GFP+ notochord cells. H Overlay of individual tracks of control (RFP+/GFP− SCPs; orange and blue lines) and Alcama-ΔN-eGFP expressing SCPs (black and red lines). nExp = 5, nembryos = 7, ntracked cells = 29 and 17 for Alcama-ΔN-eGFP+ and control RFP+/GFP− SCPs, respectively. I Overlay of individual tracks of control (RFP+/GFP− SCPs; orange and blue lines) and Alcama-ΔPDZ-eGFP+ SCPs (black and red lines). nExp = 4, nembryos = 5, ntracked cells = 32 and 17 for Alcama-ΔPDZ-eGFP+ and control SCPs, respectively. J Frequency histogram of D/V migration patterns of Alcama-ΔN-eGFP+ and -ΔPDZ-eGFP+ cells compared with GFP+ cells of Tg(cspg4:Gal4;UAS:GFP) embryos at 38 hpf. The number of embryos analyzed was 24 (WT), 36 (Alcama-ΔN), and 44 (Alcama-ΔPDZ) from three independent experiments. nc notochord. Source data for B, C, D H, I, and J are provided as a Source Data file.