
|
Fig. 3
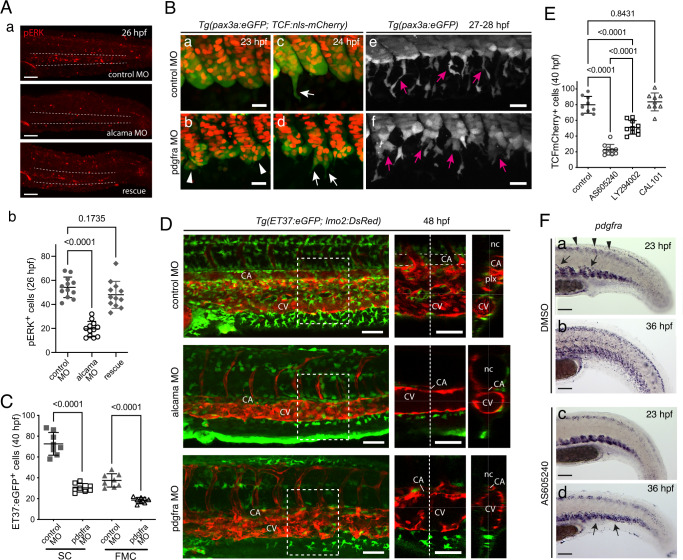
A (a) Immunofluorescence for pERK at 26 hpf in the tail region of embryos injected with control MO, alcama MO, or alcama MO + alcama mRNA (“rescue”); n = 12 embryos from two independent experiments. Dashed lines indicate the CHT border. b Quantification of a (n = 12 embryos for each group; mean ± SD; one-way ANOVA followed by Dunnett’s multiple comparison test). B Confocal projections of live control (a, c, e) or pdgfra (b, d, f) MO-injected Tg(ET37:eGFP; TCF:nls-mCherry) embryos from 23 to 28 hpf. Arrowheads point at cohesion defects observed in the VCs of pdgfra MO-injected embryos. White and magenta arrows indicate emerging (c, d) and migrating (e, f) SCPs, respectively; n = 9 for each condition from three independent experiments. Scale bars, 25 µm. C Quantification of ET37:eGFP+ stromal cells and FMCs in control and pdgfra MO-injected embryos at 40 hpf (n = 8 for each group, from the same experiment; mean ± SD; two-tailed Student’s t-test). D Confocal maximum projections of control, alcama, and pdgfra MO-injected Tg(ET37:eGFP; lmo2:DsRed) embryos at 48 hpf. An enlarged view of the area enclosed by the dashed square is shown in the middle panel (single slice image), where a dotted vertical line shows the position of the orthogonal projection (transverse section) shown in the right panel; n = 6 for each condition from three independent experiments. Scale bars, 50 µm. E Quantification of TCF:nls-mCherry+ stromal cells in the CHT of control embryos (n = 9), or embryos treated from 20 hpf with AS605240 (n = 10), LY294002 (n = 10), or CAL101 (n = 9) at 40 hpf (mean ± SD; one-way ANOVA followed by Tukey’s multiple comparison test). F WISH for pdgfra at 23 and 36 hpf in 0.2% DMSO (control) and AS605240-treated embryos. Arrows and arrowheads in (a) indicate VC cells migrating toward the notochord and dorsal mesenchymal cells at 23 hpf, respectively. Arrows in d show SCPs slightly dispersed around the VCs at 36 hpf. n = 12 for each condition from two independent experiments. CA caudal artery, CV definitive caudal vein, Plx venous plexus, nc notochord. Source data for A-b, C, and E are provided as a Source Data file.