
- Title
-
Transgenic IDH2R172K and IDH2R140Q zebrafish models recapitulated features of human acute myeloid leukemia
- Authors
- Wang, D., Zheng, L., Cheng, B.Y.L., Sin, C.F., Li, R., Tsui, S.P., Yi, X., Ma, A.C.H., He, B.L., Leung, A.Y.H., Sun, X.
- Source
- Full text @ Oncogene
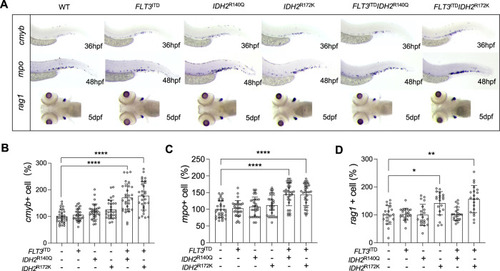
Lineage-specific expression of IDH2 mutations exacerbated hematopoiesis and myelopoiesis in zebrafish embryos.
A Brightfield images of WISH for cmyb at 36hpf, mpo at 48hpf, and rag1 at 5dpf in the mutant (n = 20) and WT (n = 20) zebrafish embryos. B Quantification of cmyb, mpo (C), and rag1 (D) respectively. The expression of each marker was presented as the percentage of each marker expressed in the mutant embryos relative to that of the WT embryos. Data are mean ± s.e.m and statistical analysis was performed by One-way Anova, *P < 0.05, **P < 0.01, ****P < 0.0001. |
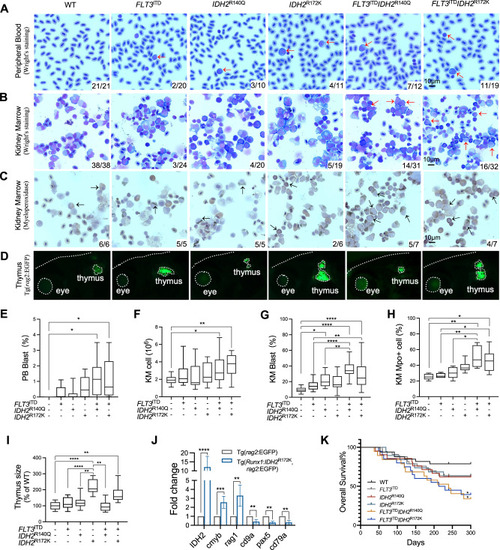
Development of AML-like disease in IDH2 mutant zebrafish.
A Representative Wright’s staining of the peripheral blood (PB) and KM cells (B), and myeloperoxidase staining of the KM cells (C) from the mutant zebrafish and WT siblings. The blast and Mpo+ cells are indicated by red and black arrows respectively. D Visualization of the thymus from the mutant and WT zebrafish via fluorescent microscopy, the edge of the fish head, thymus and eye was indicated by white dash lines in Tg(rag2:EGFP) background fish. E The percentage of the blast cell in the PB of the transgenic mutant zebrafish (n = 10) and WT siblings (n = 10). F The total cell number, the percentage of blast cell (G), the percentage of Mpo+ cells (H) in the KM of the transgenic mutant zebrafish (n = 6) compared with WT siblings (n = 6). I The relative size of the thymus in the transgenic mutant zebrafish (n = 9) compared with WT siblings (n = 9). J Relative mRNA expression of IDH2, cmyb, rag1, cd9a, pax5, and cd79a in the thymus of the IDH2R172K (n = 3) and wildtype zebrafish (n = 3). K Overall survival of the WT (n = 33), single mutant (n = 33 for FLT3ITD, n = 21 for IDH2R140Q, n = 19 for IDH2R172K), and double mutant (n = 19 for FLT3ITDIDH2R140Q, n = 20 for FLT3ITDIDH2R172K) zebrafish. The numbers in the bottom right-hand corner in A–C indicated the number of fish with the characteristic phenotypes / the total number of fish in each group. Data are mean ± s.e.m. One-way Anova was performed for E, F, G, H, and I, *P < 0.05, **P < 0.01, ****P < 0.0001. Student’s t test was performed for J, **P < 0.01, ***P < 0.001, ****P < 0.0001. Log-Rank test was performed for K, *P < 0.05. |
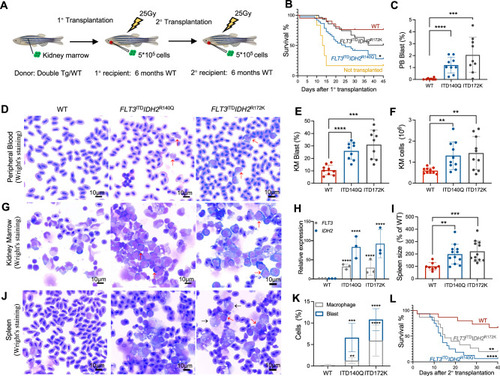
Expanded leukemic blast population and transplantability of FLT3ITD and IDH2 double mutant zebrafish.
A Schematic representation of the transplantation procedure. B Survival plots of the irradiated recipients without transplantation (n = 6) or transplanted with KM cells from double transgenic mutant zebrafish (n = 32 for FLT3ITDIDH2R140Q, n = 25 for FLT3ITDIDH2R172K) or WT(n = 21) 40 days post-primary transplantation. C The percentage of the blast cell in the PB and the representative Wright’s staining of the PB (D) of the primary recipients (n = 6 for all groups) 30 days post-transplantation. E The percentage of the blast cell and the total cell number (F) in the KM and the representative Wright’s staining of the KM (G) of the primary recipients (n = 6 for all groups) 30 days post-transplantation. H Relative mRNA expression of FLT3 and IDH2 in the KM of the primary recipients (n = 3 for all groups). I The size and the representative Wright’s staining of the spleen (J), and the percentage of the blast cell and macrophages in the spleens (K) of the primary recipients (n = 5 for all groups) 30 days post-transplantation. Blast cells and macrophages are indicated by red and black arrows respectively. L Survival plot of the irradiated secondary recipients (n = 16 for FLT3ITDIDH2R140Q, n = 15 for others) 40 days post-transplantation. Data are mean ± s.e.m. Student’s t test was performed for C, E, F, H, I, and K (each mutant group vs. WT), **P < 0.01, ***P < 0.001, ****P < 0.0001. Log-Rank test was performed for B and L, *P < 0.05, **P < 0.01, ****P < 0.0001. |
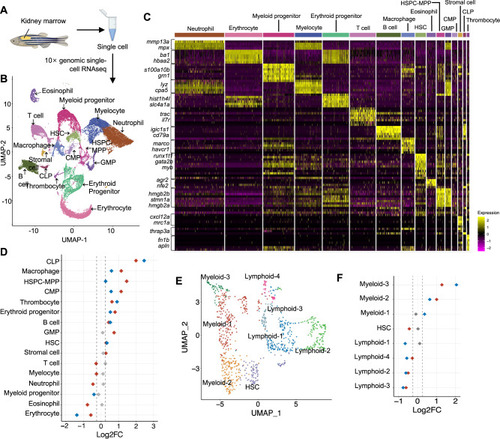
Combined expression FLT3ITD and IDH2 mutations initiated myeloid skewing at the HSPC level in zebrafish.
A Schematic representation of the single-cell RNA sequencing experimental workflow. B 16 distinct cell clusters were visualized by Uniform manifold approximation projection (UMAP). C Cell type classification based on the key hematopoietic markers identified in zebrafish. D Quantitation of proportions of distribution between double mutant and WT KM cells in different clusters. E Sub-clustering of HSPC-MPP population. F Quantitation of proportions of distribution between double mutant and WT zebrafish in the different sub-clusters of HSPC-MPP. The red dot represents the difference of the Log2FC of the proportion of a specific cluster in Tg(Runx1:FLT3ITDIDH2R140Q) compared to that of WT is over 0.25 or less than −0.25, the blue dot represents the difference of the Log2FC of the proportion of a specific cluster in Tg(Runx1:FLT3ITDIDH2R172K) compared to that of WT is over 0.25 or less than −0.25, and the gray dot indicates no change (−0.25 < log2FC < 0.25) was found in the proportion of a specific cluster when compared between the double mutant and WT zebrafish. |
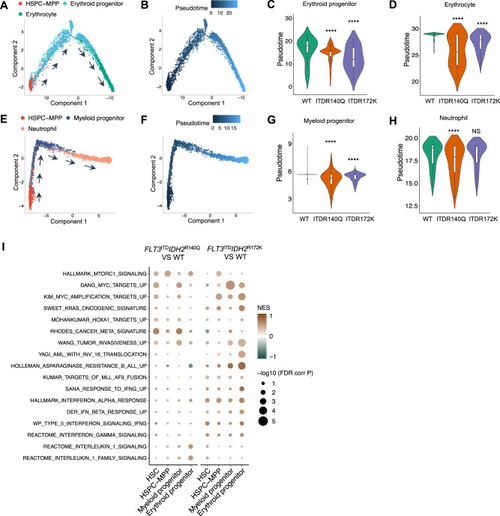
Single-cell RNA sequencing revealed differentiation blockade and enrichment of leukemia-associated gene signatures in FLT3ITD and IDH2 double mutant zebrafish.
A Lineage differentiation trajectory and pseudotime (B) analysis for the erythroid lineage, with HSPC-MPP as the starting point. C Quantification of the pseudotime values of the erythroid progenitor and erythrocyte (D) in the double mutant and wildtype zebrafish. E Lineage differentiation trajectory and pseudotime (F) analysis for the myeloid lineage, with HSPC-MPP as the starting point. G Quantification of the pseudotime values of the myeloid progenitor and neutrophil (H) in the double mutant and WT zebrafish. I Differentially enriched Hallmark and C2 pathway signatures within the HSC, HSPC-MPP, myeloid, and erythroid progenitor clusters between Tg(Runx1:FLT3ITDIDH2R140Q) and WT or Tg(Runx1:FLT3ITDIDH2R172K) and WT. Wilcoxon Rank Sum test was performed for C, D, G, and H, ****P < 0.0001. |
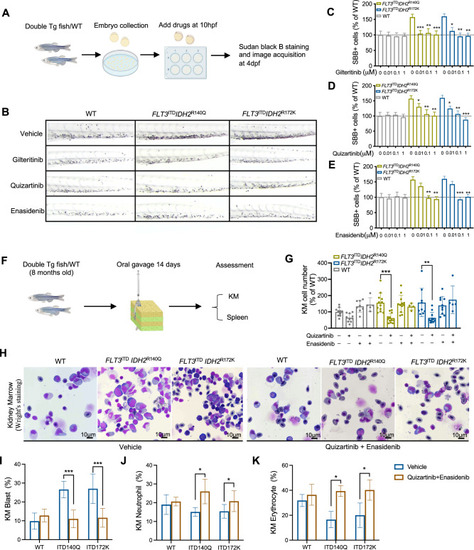
Response of the FLT3ITD and IDH2 double mutant zebrafish to therapeutic treatments.
A Schematic representation of drug administration and assessment in zebrafish embryos. B Representative SBB staining in the double mutant and WT embryos following in vivo treatment of vehicle control, gilteritinib, quizartinib, and enasidenib at 0.01 μM, 0.1 μM and 1 μM respectively. C–E Quantification of SBB + cells, presented as the percentage of SBB + cells of treated zebrafish for relative to untreated WT control (n = 20 for all groups) in B. F Schematic representation of drug administration and assessment in adult zebrafish. G Changes in total KM cellularity in the adult double mutant and WT zebrafish post-treatment. H Representative Wright’s staining of the KM from the adult double mutant and WT zebrafish 14 days post-treatment. I The percentage of blast cell, neutrophil (J), and erythrocyte (K) in the KM of double mutant and WT zebrafish (n = 5 for all groups). Data are mean ± s.e.m and statistical analysis was performed by Student’s t test (treated vs. untreated for each genotype), *P < 0.05, **P < 0.01, ***P < 0.001. |