
|
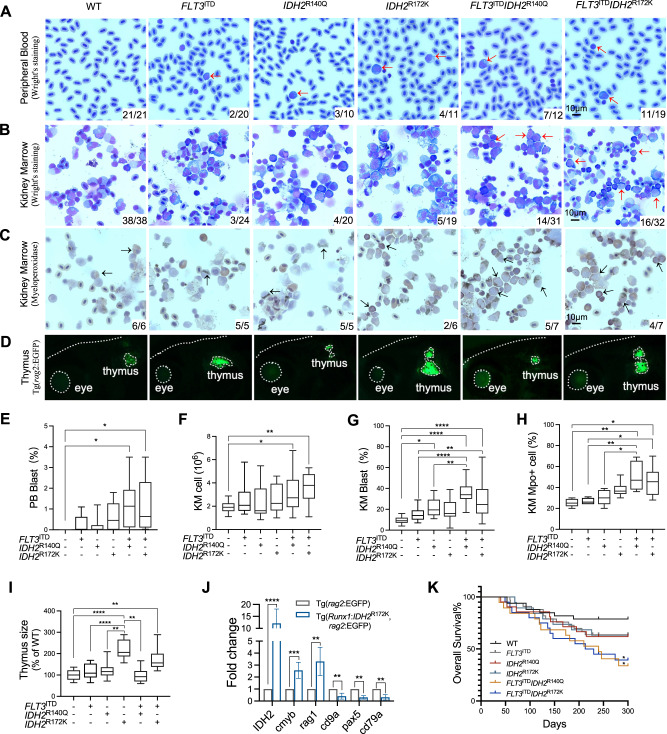
Fig. 2
A Representative Wright’s staining of the peripheral blood (PB) and KM cells (B), and myeloperoxidase staining of the KM cells (C) from the mutant zebrafish and WT siblings. The blast and Mpo+ cells are indicated by red and black arrows respectively. D Visualization of the thymus from the mutant and WT zebrafish via fluorescent microscopy, the edge of the fish head, thymus and eye was indicated by white dash lines in Tg(rag2:EGFP) background fish. E The percentage of the blast cell in the PB of the transgenic mutant zebrafish (n = 10) and WT siblings (n = 10). F The total cell number, the percentage of blast cell (G), the percentage of Mpo+ cells (H) in the KM of the transgenic mutant zebrafish (n = 6) compared with WT siblings (n = 6). I The relative size of the thymus in the transgenic mutant zebrafish (n = 9) compared with WT siblings (n = 9). J Relative mRNA expression of IDH2, cmyb, rag1, cd9a, pax5, and cd79a in the thymus of the IDH2R172K (n = 3) and wildtype zebrafish (n = 3). K Overall survival of the WT (n = 33), single mutant (n = 33 for FLT3ITD, n = 21 for IDH2R140Q, n = 19 for IDH2R172K), and double mutant (n = 19 for FLT3ITDIDH2R140Q, n = 20 for FLT3ITDIDH2R172K) zebrafish. The numbers in the bottom right-hand corner in A–C indicated the number of fish with the characteristic phenotypes / the total number of fish in each group. Data are mean ± s.e.m. One-way Anova was performed for E, F, G, H, and I, *P < 0.05, **P < 0.01, ****P < 0.0001. Student’s t test was performed for J, **P < 0.01, ***P < 0.001, ****P < 0.0001. Log-Rank test was performed for K, *P < 0.05.