Fig. 5
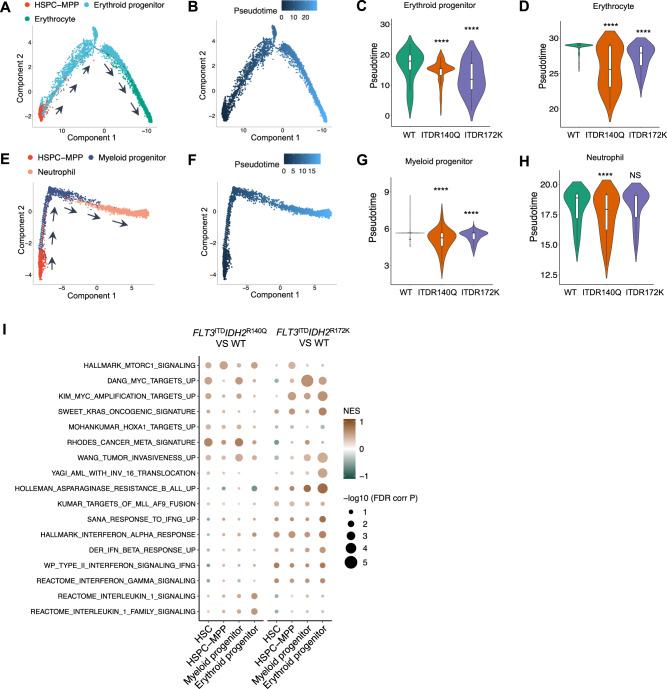
A Lineage differentiation trajectory and pseudotime (B) analysis for the erythroid lineage, with HSPC-MPP as the starting point. C Quantification of the pseudotime values of the erythroid progenitor and erythrocyte (D) in the double mutant and wildtype zebrafish. E Lineage differentiation trajectory and pseudotime (F) analysis for the myeloid lineage, with HSPC-MPP as the starting point. G Quantification of the pseudotime values of the myeloid progenitor and neutrophil (H) in the double mutant and WT zebrafish. I Differentially enriched Hallmark and C2 pathway signatures within the HSC, HSPC-MPP, myeloid, and erythroid progenitor clusters between Tg(Runx1:FLT3ITDIDH2R140Q) and WT or Tg(Runx1:FLT3ITDIDH2R172K) and WT. Wilcoxon Rank Sum test was performed for C, D, G, and H, ****P < 0.0001.

