
Fig. 6
- ID
- ZDB-FIG-230420-71
- Publication
- Wang et al., 2023 - Transgenic IDH2R172K and IDH2R140Q zebrafish models recapitulated features of human acute myeloid leukemia
- Other Figures
- All Figure Page
- Back to All Figure Page
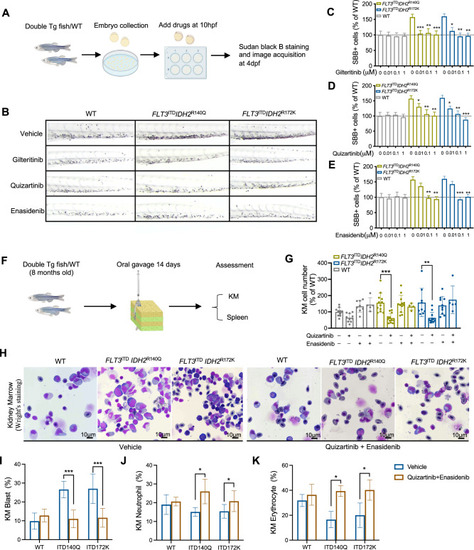
Response of the FLT3ITD and IDH2 double mutant zebrafish to therapeutic treatments.
A Schematic representation of drug administration and assessment in zebrafish embryos. B Representative SBB staining in the double mutant and WT embryos following in vivo treatment of vehicle control, gilteritinib, quizartinib, and enasidenib at 0.01 μM, 0.1 μM and 1 μM respectively. C–E Quantification of SBB + cells, presented as the percentage of SBB + cells of treated zebrafish for relative to untreated WT control (n = 20 for all groups) in B. F Schematic representation of drug administration and assessment in adult zebrafish. G Changes in total KM cellularity in the adult double mutant and WT zebrafish post-treatment. H Representative Wright’s staining of the KM from the adult double mutant and WT zebrafish 14 days post-treatment. I The percentage of blast cell, neutrophil (J), and erythrocyte (K) in the KM of double mutant and WT zebrafish (n = 5 for all groups). Data are mean ± s.e.m and statistical analysis was performed by Student’s t test (treated vs. untreated for each genotype), *P < 0.05, **P < 0.01, ***P < 0.001. |