
- Title
-
Hyperaminoacidemia induces pancreatic α cell proliferation via synergism between the mTORC1 and CaSR-Gq signaling pathways
- Authors
- Gong, Y., Yang, B., Zhang, D., Zhang, Y., Tang, Z., Yang, L., Coate, K.C., Yin, L., Covington, B.A., Patel, R.S., Siv, W.A., Sellick, K., Shou, M., Chang, W., Danielle Dean, E., Powers, A.C., Chen, W.
- Source
- Full text @ Nat. Commun.

Elevated free amino acids and α cell mTORC1 activity in gcgrDKO zebrafish.
a The free amino acid levels of control and gcgrDKO larvae at 5 dpf, normalized by total protein concentration (Data represent means ± SD, n = 6, 40 fish/replicate, for each group). b Serum-free amino acid levels of control and gcgrDKO zebrafish adults (data represent the means ± SD, n = 6 for each group). c Representative images of pS6(240/244) and GFP immunofluorescence in islet sections of control and gcgrDKO larvae at 5 dpf. The pS6(240/244) signal in α cell is indicated by arrows, primary antibody: anti-pS6 (Ser240/244) (1:300, rabbit); secondary antibody: Alexa Fluor 568 (1:1000, goat anti-rabbit) (scale bar, 8 μm). d Quantification of the percentage of pS6(240/244) positive α cells in control and gcgrDKO larvae at 5 dpf (data represent the means ± SD, n = 9 for each group). e Quantification of the pS6(240/244) fluorescence intensity in α cells of control and gcgrDKO larvae at 5 dpf (data represent the means ± SD, n = 9 for each group). *P < 0.05, **P < 0.01, ***P < 0.001 (two-tailed unpaired t test, the quantifications represent individual islet sections). Source data are provided as a Source Data file. |
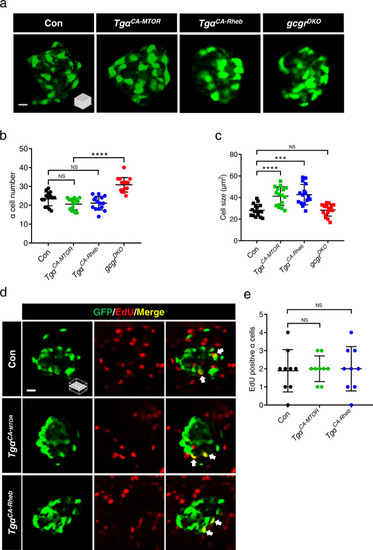
Activation of mTORC1 is insufficient for α cell proliferation.
a Representative images of α cells in control, TgαCA-MTOR (Tg(gcga:MTORL1460P, cryaa:tagRFP)), TgαCA-Rheb (Tg(gcga:RhebS16H, cryaa:tagYFP)), and gcgrDKO (gcgra−/−;gcgra−/−) larvae at 5 dpf (scale bar, 10 μm). b Quantification of α cell number in control, TgαCA-MTOR, TgαCA-Rheb and gcgrDKO larvae at 5 dpf (data represent the means ± SD, n = 15 for each group). c Quantification of α cell size in control, TgαCA-MTOR, TgαCA-Rheb and gcgrDKO larvae at 5 dpf (Data represent means ± SD, n = 16 for each group). d Representative images of EdU staining in control, TgαCA-MTOR and TgαCA-Rheb larvae at 5 dpf. EdU (red)-positive α cells are indicated by arrows (scale bar, 10 μm). e Quantification of EdU-positive α cell numbers in control, TgαCA-MTOR and TgαCA-Rheb larvae at 5 dpf (data represent the means ± SD, n = 9 for each group). ***P < 0.001, ****P < 0.0001, NS indicates no significant difference (one-way ANOVA, Tukey’s multiple comparisons test, the quantifications represent individual islet sections). Source data are provided as a Source Data file. |
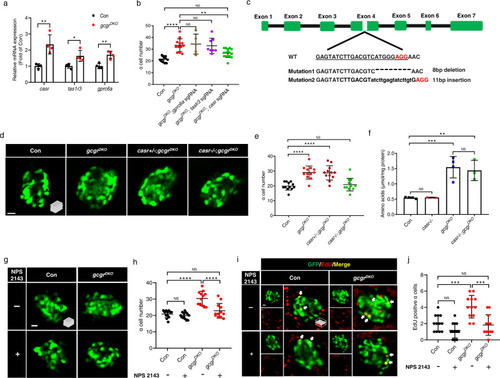
CaSR is required for α cell proliferation in gcgrDKO zebrafish.
a qPCR analysis of islet amino acid sensing GPCRs (gprc6a, tas1r3, casr) (data represent the means ± SD, n = 4 for each group). b Quantification of α cell number in 5 dpf larvae of control, gcgrDKO, and gcgrDKO with knockdown of amino acid sensing GPCRs (gprc6a, tas1r3, casr) (Data represent means ± SD, n = 12, 12, 5, 8, 16 for each group). c. Diagram of casr CRISPR mutagenesis including target location, target sequence (underlined), PAM (red) and characterized mutations. Lower case letters indicate insertion. Hyphens represents deletion. d. Representative images of α cells in control, gcgrDKO, cas+/-;gcgrDKO and casr−/−;gcgrDKO larvae at 5 dpf (scale bar, 10 μm). e Quantification of α cell numbers in control, gcgrDKO, cas+/-;gcgrDKO and casr−/−;gcgrDKO larvae at 5 dpf (data represent the means ± SD, n = 12 for each group). f Free amino acid levels of control, casr−/−, gcgrDKO, and casr−/−;gcgrDKO larvae at 5 dpf, normalized by total protein concentration (data represent the means ± SD, n = 3/4, 40 fish/replicate, for each group). g Representative images of α cells in control and gcgrDKO larvae treated with 1 μM NPS 2143 or vehicle for 48 h at 5 dpf (scale bar, 10 μm). h Quantification of α cell numbers in control and gcgrDKO larvae treated with 1 μM NPS 2143 or vehicle for 48 h at 5 dpf (data represent the means ± SD, n = 12 for each group). i. Representative images of EdU staining in control and gcgrDKO larvae treated with 1 μM NPS 2143 or vehicle for 48 h at 5 dpf. EdU (red)-positive α cells are indicated by arrows (scale bar, 10 μm). j. Quantification of EdU positive α cell numbers in control and gcgrDKO larvae treated with 1 μM NPS 2143 or vehicle for 48 h at 5 dpf (data represent the means ± SD, n = 12 for each group). *P < 0.05, **P < 0.01, ***P < 0.001, ****P < 0.0001, NS means no significant difference (two-tailed unpaired t test was used for Fig. 2a. One-way ANOVA and Tukey’s multiple comparisons test were used for Fig. 2b, e, f, h and j; the quantifications represent individual islet sections). Source data are provided as a Source Data file. |
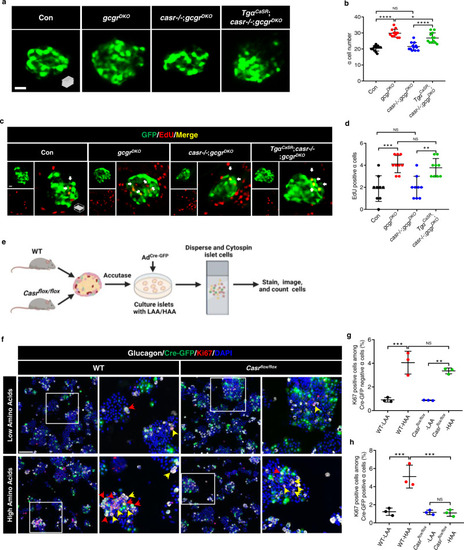
Hyperaminoacidemia-induced α cell proliferation requires CaSR cell-autonomously.
a Representative images of α cells in control, gcgrDKO, casr−/−;gcgrDKO and TgαCaSR(Tg(gcga:CASR, cryaa:tagRFP));casr−/−;gcgrDKO larvae at 5 dpf (scale bar, 10 μm). b Quantification of α cell numbers in control, gcgrDKO, casr−/−;gcgrDKO and TgαCaSR;casr−/−;gcgrDKO larvae at 5 dpf (data represent the means ± SD, n = 12 for each group). c Representative images of EdU staining in control, gcgrDKO, casr−/−;gcgrDKO and TgαCaSR;casr−/−;gcgrDKO larvae at 5 dpf. EdU (Red) positive α cells are indicated by arrows (scale bar, 10 μm). d Quantification of EdU positive α cell number in control, gcgrDKO, casr−/−;gcgrDKO and TgαCaSR;casr−/−;gcgrDKO larvae at 5 dpf (Data represent means ± SD, n = 9 for each group). e Schematic for Casr knockdown by AdCre-GFP and α cell proliferation assays in the primary islets of Casrflox/flox and WT mice (created with BioRender.com). f Representative images of cells from primary WT and Casrflox/flox mouse islets cultured with LAA and HAA media after AdCre-GFP transduction. Ki67 (red) and Cre-GFP (green) double-positive α cells are indicated by red arrows, Ki67 (red) single-positive α cells are indicated by yellow arrows, primary antibody: Anti-GFP (1:300, chicken)/anti-Glucagon (1:200, mouse)/anti-Ki67 (1:150, rabbit); secondary antibody: Alexa Fluor 488 (1:1000, goat anti-chicken)/Alexa Fluor 647 (1:1000, goat anti-mouse)/Alexa Fluor 568 (1:1,000, goat anti-rabbit) (scale bar, 150 μm). g Quantification of the percentage of Ki67 positive cells among the Cre-GFP negative α cells of WT and Casrflox/flox mouse islets cultured with LAA and HAA media after AdCre-GFP transduction (data represent the means ± SD, n = 3 for each group). h Quantification of the percentage of Ki67 positive cells among the Cre-GFP positive α cells of WT and Casrflox/flox mouse islets cultured with LAA and HAA mediums after AdCre-GFP transduction (Data represent means ± SD, n = 3 for each group). *P < 0.05, **P < 0.01, ***P < 0.001, ****P < 0.0001, NS indicates no significant difference (one-way ANOVA, Tukey’s multiple comparisons test, the quantifications represent individual islet sections). Source data are provided as a Source Data file. |
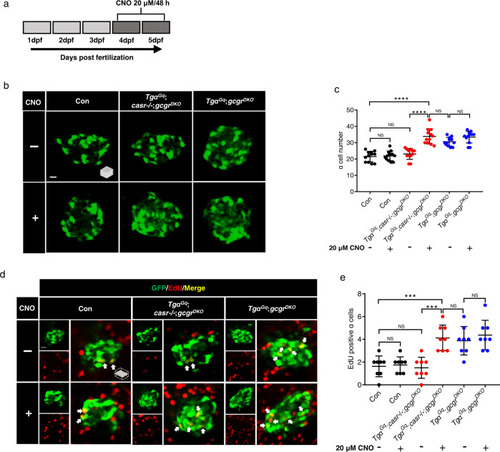
Activation of a Gq-DREADD in α cells restores proliferation in casr−/−;gcgrDKO zebrafish.
a Diagram of CNO treatment, 20 μM for 48 h. b Representative images of α cells in control, TgαGq(Tg(gcga:hM3Dq, cryaa:tagRFP));casr−/−;gcgrDKO, and TgαGq;gcgrDKO larvae with 20 μM CNO or vehicle at 5 dpf (scale bar, 10 μm). c Quantification of α cell numbers at 5 dpf in control, TgαGq;casr−/−;gcgrDKO, and TgαGq;gcgrDKO larvae treated with 20 μM CNO or vehicle for 48 h (data represent the means ± SD, n = 12 for each group). d Representative images of EdU staining at 5 dpf in control, TgαGq;casr−/−;gcgrDKO and TgαGq; gcgrDKO larvae treated with 20 μM CNO or vehicle for 48 h. EdU (red)-positive α cells are indicated by arrows (scale bar, 10 μm). e Quantification of EdU-positive α cell numbers at 5 dpf in control, TgαGq;casr−/−;gcgrDKO, and TgαGq;gcgrDKO larvae treated with 20 μM CNO or vehicle for 48 h (data represent the means ± SD, n = 8 for each group). ***P < 0.001, ****P < 0.0001, NS indicates no significant difference (One-way ANOVA, Tukey’s multiple comparisons test, the quantifications represent individual islet sections). Source data are provided as a Source Data file. |

Synergism of the Gq and mTORC1 pathways is sufficient to induce α cell proliferation.
a Representative images of EdU staining in control, TgαCA-Rheb, TgαGq, and TgαCA-Rheb;TgαGq larvae treated with 1 μM CNO or vehicle for 48 h at 5 dpf. EdU (red)-positive α cells are indicated by arrows (scale bar, 10 μm). b Quantification of α cell numbers in control, TgαCA-Rheb, TgαGq, and TgαCA-Rheb;TgαGq larvae treated with 1 μM CNO or vehicle for 48 h at 5 dpf. (data represent the means ± SD, n = 8, 8, 6, 8, 8, 6, 9, and 11 for each group, respectively). c Quantification of EdU-positive α cell numbers in control, TgαCA-Rheb, TgαGq, and TgαCA-Rheb;TgαGq larvae treated with 1 μM CNO or vehicle for 48 h at 5 dpf (data represent the means ± SD, n = 9 for each group). d Representative images of α cells in control, gcgrDKO, and TgαGq larvae treated with 20 μM CNO or vehicle for 48 h at 5 dpf (scale bar, 10 μm). e Quantification of α cell numbers in control, gcgrDKO and TgαGq larvae treated with 20 μM CNO or vehicle for 48 h at 5 dpf (data represent the means ± SD, n = 9, 9, 9, 9, 5, and 5 for each group, respectively). f Representative images of EdU staining in control, gcgrDKO and TgαGq larvae treated with 20 μM CNO or vehicle for 48 h at 5 dpf. EdU (red)-positive α cells are indicated by arrows (scale bar, 10 μm). g Quantification of EdU-positive α cell numbers in control, gcgrDKO and TgαGq larvae treated with 20 μM CNO or vehicle for 48 h at 5 dpf (data represent the means ± SD, n = 10, 10, 10, 10, 5, and 5 for each group, respectively). *P < 0.05, **P < 0.01, ***P < 0.001, ****P < 0.0001, NS indicates no significant difference (one-way ANOVA, Tukey’s multiple comparisons test, the quantifications represent individual islet sections). Source data are provided as a Source Data file. |
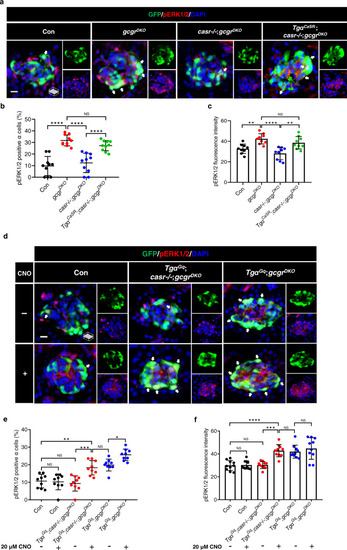
CaSR-Gq induces α cell proliferation via the ERK1/2 pathway.
a Representative images of pERK1/2 and GFP immunofluorescence in islet sections of control, gcgrDKO, casr−/−;gcgrDKO and TgαCaSR;casr−/−;gcgrDKO larvae at 5 dpf. The pERK1/2 signal in α cells is indicated by arrows, primary antibody: Anti-pERK1/2 (Thr202/Tyr204) (1:150, rabbit); secondary antibody: Alexa Fluor 568 (1:1,000, goat anti-rabbit) (scale bar, scale bar, 8 μm). b Quantification of the percentage of pERK1/2 positive α cells in control, gcgrDKO, casr−/−;gcgrDKO and TgαCaSR;casr−/−;gcgrDKO larvae at 5 dpf (data represent the means ± SD, n = 10 for each group). c Quantification of pERK1/2 fluorescence intensity in α cell of control, gcgrDKO, casr−/−;gcgrDKO, and TgαCaSR;casr−/−;gcgrDKO larvae at 5 dpf (Data represent means ± SD, n = 9 for each group). d Representative images of pERK1/2 and GFP immunofluorescence in islet sections of control, TgαGq;casr−/−;gcgrDKO and TgαGq;gcgrDKO larvae at 5 dpf. The larvae were treated with 20 μM CNO or vehicle for 48 h. The pERK1/2 signal in α cells is indicated by arrows, primary antibody: Anti-pERK1/2 (Thr202/Tyr204) (1:150, rabbit); secondary antibody: Alexa Fluor 568 (1:1000, goat anti-rabbit) (scale bar, 8 μm). e Quantification of the percentage of pERK1/2 positive α cells in control, TgαGq;casr−/−;gcgrDKO and TgαGq;gcgrDKO larvae treated with 20 μM CNO or vehicle for 48 h at 5 dpf (data represent the means ± SD, n = 9 for each group). f Quantification of the pERK1/2 fluorescence intensity in α cells of control, TgαGq;casr−/−;gcgrDKO and TgαGq;gcgrDKO larvae treated with 20 μM CNO or vehicle for 48 h at 5 dpf (data represent the means ± SD, n = 10 for each group). *P < 0.05, **P < 0.01, ***P < 0.001, ****P < 0.0001, NS indicates no significant difference (one-way ANOVA, Tukey’s multiple comparisons test, the quantifications represent individual islet sections). Source data are provided as a Source Data file. |
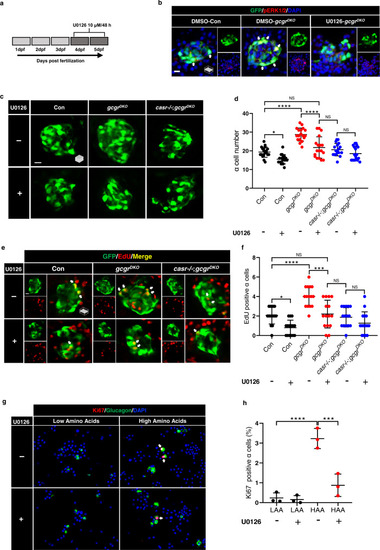
Mek1/2 activation is necessary for α cell proliferation.
a Diagram of 48-h treatment with 10 μM U0126. b. Representative images of pERK1/2 and GFP immunofluorescence in islet sections of control and gcgrDKO larvae treated with vehicle, 10 μM U0126 for 48 h at 5 dpf. The pERK1/2 signal in α cells is indicated by arrows, primary antibody: anti-pERK1/2 (Thr202/Tyr204) (1:150, rabbit); secondary antibody: Alexa Fluor 568 (1:1000, goat anti-rabbit) (scale bar, 7 μm). c Representative images of α cells at 5 dpf in control, gcgrDKO and casr−/−;gcgrDKO larvae treated with 10 μM U0126 or vehicle for 48 h (scale bar, 10 μm). d Quantification of α cell number at 5 dpf in control, gcgrDKO and casr−/−;gcgrDKO larvae treated with 10 μM U0126 or vehicle for 48 h (data represent the means ± SD, n = 18 for each group). e Representative images of EdU staining at 5 dpf in control, gcgrDKO and casr−/−;gcgrDKO larvae treated with 10 μM U0126 or vehicle for 48 h. EdU (Red) positive α cells are indicated by arrows (scale bar, 10 μm). f Quantification of EdU positive α cell numbers at 5 dpf in control, gcgrDKO and casr−/−;gcgrDKO larvae treated with 10 μM U0126 or vehicle for 48 h (data represent the means ± SD, n = 15 for each group). g Representative images of cells from primary mouse islets cultured in LAA and HAA medium with 10 μM U0126 or vehicle. Ki67 (red)-positive α cells are indicated by arrows, primary antibody: anti-Glucagon (1:200, mouse)/anti-Ki67 (1:150, rabbit); secondary antibody: Alexa Fluor 488 (1:1000, goat anti-mouse)/Alexa Fluor 568 (1:1000, goat anti-rabbit) (scale bar, 50 μm). h Quantification of the percentage of Ki67 positive α cells in dispersed cells from cultured islet cells in LAA and HAA media with 10 μM U0126 or vehicle. (data represent the means ± SD, n = 3 for each group). ***P < 0.001, ****P < 0.0001, NS indicates no significant difference (one-way ANOVA, Tukey’s multiple comparisons test, the quantifications represent individual islet sections). Source data are provided as a Source Data file. |
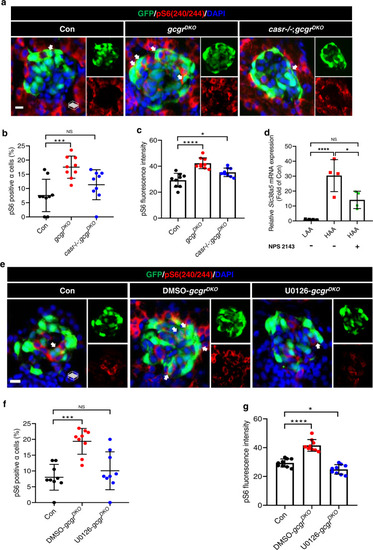
Hyperaminoacidemia-induced mTORC1 activation in α cells requires CaSR and Mek1/2.
a Representative images of pS6(240/244) and GFP immunofluorescence in islet sections of control, gcgrDKO and casr−/−;gcgrDKO larvae at 5 dpf. The pS6(240/244) signal in α cells is indicated by arrows, primary antibody: Anti-pS6 (Ser240/244) (1:300, rabbit); secondary antibody: Alexa Fluor 568 (1:1000, goat anti-rabbit) (scale bar, 7 μm). b Quantification of the percentage of pS6(240/244) positive α cells in control, gcgrDKO, and casr−/−;gcgrDKO larvae at 5 dpf (data represent the means ± SD, n = 9 for each group). c Quantification of the pS6(240/244) fluorescence intensity in α cells of control, gcgrDKO and casr−/−;gcgrDKO larvae at 5 dpf (data represent the means ± SD, n = 9 for each group). d qPCR analysis of Slc38a5 in mouse islets cultured in LAA and HAA media with or without 0.5 µM NPS 2143 for 4 days. (data represent the means ± SD, n = 4 for each group). e Representative images of pS6(240/244) and GFP immunofluorescence in islet sections of control and gcgrDKO larvae treated with 10 μM U0126 or vehicle for 48 h at 5 dpf. The pS6(240/244) signal in α cells is indicated by arrows, primary antibody: Anti-pS6 (Ser240/244) (1:300, rabbit); secondary antibody: Alexa Fluor 568 (1:1000, goat anti-rabbit) (scale bar, 7 μm). f Quantification of the percentage of pS6(240/244) positive α cells in control and gcgrDKO larvae treated with 10 μM U0126 or vehicle for 48 h at 5 dpf (data represent the means ± SD, n = 9 for each group). g Quantification of the pS6(240/244) fluorescence intensity in α cells of control and gcgrDKO larvae treated with 10 μM U0126 or vehicle for 48 h at 5 dpf (data represent the means ± SD, n = 9 for each group). *P < 0.05, ***P < 0.001, ****P < 0.0001, NS indicates no significant difference (one-way ANOVA, Tukey’s multiple comparisons test, the quantifications represent individual islet sections). Source data are provided as a Source Data file. |
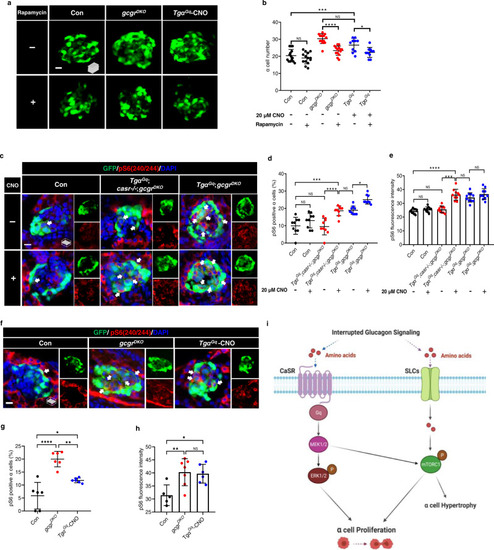
Gq hyperactivation-induced α cell proliferation requires mTORC1.
a Representative images of α cells at 5 dpf in control, gcgrDKO and TgαGq-CNO larvae treated with 2.5 μM rapamycin or vehicle for 48 h (scale bar, 10 μm). b Quantification of α cell number at 5 dpf in control, gcgrDKO and TgαGq-CNO larvae treated with o 2.5 μM rapamycin or vehicle (data represent the means ± SD, n = 14, 14, 14, 14, 10, and 10 for each group, respectively). c Representative images of pS6(240/244) and GFP immunofluorescence in islet sections of control, TgαGq;casr−/−;gcgrDKO and TgαGq;gcgrDKO at 5 dpf. The larvae were treated with 20 μM CNO or vehicle. The pS6(240/244) signal in α cell is indicated by arrows, primary antibody: Anti-pS6 (Ser240/244) (1:300, rabbit); secondary antibody: Alexa Fluor 568 (1:1000, goat anti-rabbit) (scale bar, 7 μm). d Quantification of pS6(240/244) positive α cell percentages in control, TgαGq;casr−/−;gcgrDKO and TgαGq;gcgrDKO larvae treated with 20 μM CNO or vehicle at 5 dpf (Data represent means ± SD, n = 9 for each group). e Quantification of pS6(240/244) fluorescence intensity in α cells of control, TgαGq;casr−/−;gcgrDKO and TgαGq;gcgrDKO larvae with 20 μM CNO or vehicle at 5 dpf (data represent the means ± SD, n = 10 for each group). f Representative images of pS6(240/244) and GFP immunofluorescence in islet sections of control, gcgrDKO and TgαGq with 20 μM CNO at 5 dpf. The pS6(240/244) signal in α cells is indicated by arrows, primary antibody: anti-pS6 (Ser240/244) (1:300, rabbit); secondary antibody: Alexa Fluor 568 (1:1000, goat anti-rabbit) (scale bar, 7 μm). g Quantification of pS6(240/244) positive α cell percentages in control, gcgrDKO, and TgαGq larvae treated with 20 μM CNO larvae at 5 dpf (data represent the means ± SD, n = 6 for each group). h Quantification of pS6(240/244) fluorescence intensity in α cells of control, gcgrDKO, and TgαGq with 20 μM CNO larvae at 5 dpf (data represent the means ± SD, n = 5, 7, and 6 for each group, respectively). i Working model depicting the necessary and sufficient signaling pathways for hyperaminoacidemia-induced α cell proliferation: Interrupting glucagon signaling results in hyperaminoacidemia. The amino acid surge activates the CaSR-Gq-Mek1/2-ERK1/2 pathway. Concurrently, amino acids are transported into the cytoplasm and possibly lysosomes to activate mTORC1. mTORC1 is further activated by the CaSR-Gq-Mek1/2 pathway through an as-yet-unknown mechanism. The synergism between the CaSR-Gq and mTORC1 pathways mediates hyperaminoacidemia-induced α cell proliferation. *P < 0.05, **P < 0.01, ***P < 0.001, ****P < 0.0001, NS indicates no significant difference (one-way ANOVA and Tukey’s multiple comparisons test, the quantifications represent individual islet sections). Source data are provided as a Source Data file. |