
Fig. 4
- ID
- ZDB-FIG-230122-14
- Publication
- Gong et al., 2023 - Hyperaminoacidemia induces pancreatic α cell proliferation via synergism between the mTORC1 and CaSR-Gq signaling pathways
- Other Figures
- All Figure Page
- Back to All Figure Page
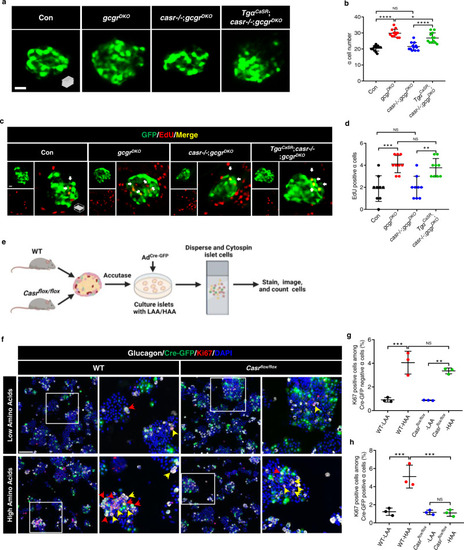
Hyperaminoacidemia-induced α cell proliferation requires CaSR cell-autonomously.
a Representative images of α cells in control, gcgrDKO, casr−/−;gcgrDKO and TgαCaSR(Tg(gcga:CASR, cryaa:tagRFP));casr−/−;gcgrDKO larvae at 5 dpf (scale bar, 10 μm). b Quantification of α cell numbers in control, gcgrDKO, casr−/−;gcgrDKO and TgαCaSR;casr−/−;gcgrDKO larvae at 5 dpf (data represent the means ± SD, n = 12 for each group). c Representative images of EdU staining in control, gcgrDKO, casr−/−;gcgrDKO and TgαCaSR;casr−/−;gcgrDKO larvae at 5 dpf. EdU (Red) positive α cells are indicated by arrows (scale bar, 10 μm). d Quantification of EdU positive α cell number in control, gcgrDKO, casr−/−;gcgrDKO and TgαCaSR;casr−/−;gcgrDKO larvae at 5 dpf (Data represent means ± SD, n = 9 for each group). e Schematic for Casr knockdown by AdCre-GFP and α cell proliferation assays in the primary islets of Casrflox/flox and WT mice (created with BioRender.com). f Representative images of cells from primary WT and Casrflox/flox mouse islets cultured with LAA and HAA media after AdCre-GFP transduction. Ki67 (red) and Cre-GFP (green) double-positive α cells are indicated by red arrows, Ki67 (red) single-positive α cells are indicated by yellow arrows, primary antibody: Anti-GFP (1:300, chicken)/anti-Glucagon (1:200, mouse)/anti-Ki67 (1:150, rabbit); secondary antibody: Alexa Fluor 488 (1:1000, goat anti-chicken)/Alexa Fluor 647 (1:1000, goat anti-mouse)/Alexa Fluor 568 (1:1,000, goat anti-rabbit) (scale bar, 150 μm). g Quantification of the percentage of Ki67 positive cells among the Cre-GFP negative α cells of WT and Casrflox/flox mouse islets cultured with LAA and HAA media after AdCre-GFP transduction (data represent the means ± SD, n = 3 for each group). h Quantification of the percentage of Ki67 positive cells among the Cre-GFP positive α cells of WT and Casrflox/flox mouse islets cultured with LAA and HAA mediums after AdCre-GFP transduction (Data represent means ± SD, n = 3 for each group). *P < 0.05, **P < 0.01, ***P < 0.001, ****P < 0.0001, NS indicates no significant difference (one-way ANOVA, Tukey’s multiple comparisons test, the quantifications represent individual islet sections). Source data are provided as a Source Data file. |