
Fig. 5
- ID
- ZDB-FIG-230122-15
- Publication
- Gong et al., 2023 - Hyperaminoacidemia induces pancreatic α cell proliferation via synergism between the mTORC1 and CaSR-Gq signaling pathways
- Other Figures
- All Figure Page
- Back to All Figure Page
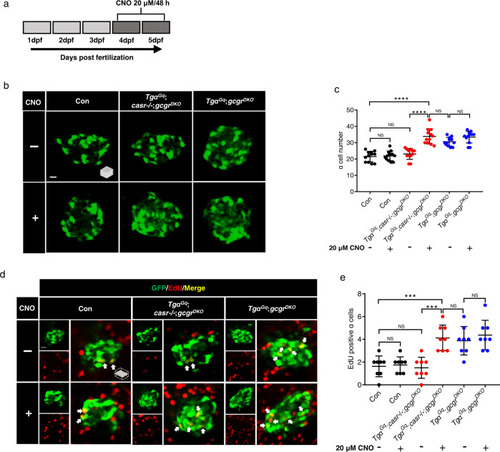
Activation of a Gq-DREADD in α cells restores proliferation in casr−/−;gcgrDKO zebrafish.
a Diagram of CNO treatment, 20 μM for 48 h. b Representative images of α cells in control, TgαGq(Tg(gcga:hM3Dq, cryaa:tagRFP));casr−/−;gcgrDKO, and TgαGq;gcgrDKO larvae with 20 μM CNO or vehicle at 5 dpf (scale bar, 10 μm). c Quantification of α cell numbers at 5 dpf in control, TgαGq;casr−/−;gcgrDKO, and TgαGq;gcgrDKO larvae treated with 20 μM CNO or vehicle for 48 h (data represent the means ± SD, n = 12 for each group). d Representative images of EdU staining at 5 dpf in control, TgαGq;casr−/−;gcgrDKO and TgαGq; gcgrDKO larvae treated with 20 μM CNO or vehicle for 48 h. EdU (red)-positive α cells are indicated by arrows (scale bar, 10 μm). e Quantification of EdU-positive α cell numbers at 5 dpf in control, TgαGq;casr−/−;gcgrDKO, and TgαGq;gcgrDKO larvae treated with 20 μM CNO or vehicle for 48 h (data represent the means ± SD, n = 8 for each group). ***P < 0.001, ****P < 0.0001, NS indicates no significant difference (One-way ANOVA, Tukey’s multiple comparisons test, the quantifications represent individual islet sections). Source data are provided as a Source Data file. |