
Fig. 8
- ID
- ZDB-FIG-230122-18
- Publication
- Gong et al., 2023 - Hyperaminoacidemia induces pancreatic α cell proliferation via synergism between the mTORC1 and CaSR-Gq signaling pathways
- Other Figures
- All Figure Page
- Back to All Figure Page
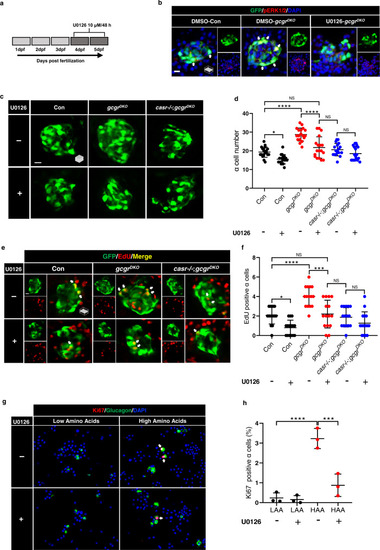
Mek1/2 activation is necessary for α cell proliferation.
a Diagram of 48-h treatment with 10 μM U0126. b. Representative images of pERK1/2 and GFP immunofluorescence in islet sections of control and gcgrDKO larvae treated with vehicle, 10 μM U0126 for 48 h at 5 dpf. The pERK1/2 signal in α cells is indicated by arrows, primary antibody: anti-pERK1/2 (Thr202/Tyr204) (1:150, rabbit); secondary antibody: Alexa Fluor 568 (1:1000, goat anti-rabbit) (scale bar, 7 μm). c Representative images of α cells at 5 dpf in control, gcgrDKO and casr−/−;gcgrDKO larvae treated with 10 μM U0126 or vehicle for 48 h (scale bar, 10 μm). d Quantification of α cell number at 5 dpf in control, gcgrDKO and casr−/−;gcgrDKO larvae treated with 10 μM U0126 or vehicle for 48 h (data represent the means ± SD, n = 18 for each group). e Representative images of EdU staining at 5 dpf in control, gcgrDKO and casr−/−;gcgrDKO larvae treated with 10 μM U0126 or vehicle for 48 h. EdU (Red) positive α cells are indicated by arrows (scale bar, 10 μm). f Quantification of EdU positive α cell numbers at 5 dpf in control, gcgrDKO and casr−/−;gcgrDKO larvae treated with 10 μM U0126 or vehicle for 48 h (data represent the means ± SD, n = 15 for each group). g Representative images of cells from primary mouse islets cultured in LAA and HAA medium with 10 μM U0126 or vehicle. Ki67 (red)-positive α cells are indicated by arrows, primary antibody: anti-Glucagon (1:200, mouse)/anti-Ki67 (1:150, rabbit); secondary antibody: Alexa Fluor 488 (1:1000, goat anti-mouse)/Alexa Fluor 568 (1:1000, goat anti-rabbit) (scale bar, 50 μm). h Quantification of the percentage of Ki67 positive α cells in dispersed cells from cultured islet cells in LAA and HAA media with 10 μM U0126 or vehicle. (data represent the means ± SD, n = 3 for each group). ***P < 0.001, ****P < 0.0001, NS indicates no significant difference (one-way ANOVA, Tukey’s multiple comparisons test, the quantifications represent individual islet sections). Source data are provided as a Source Data file. |