
|
Fig. 3
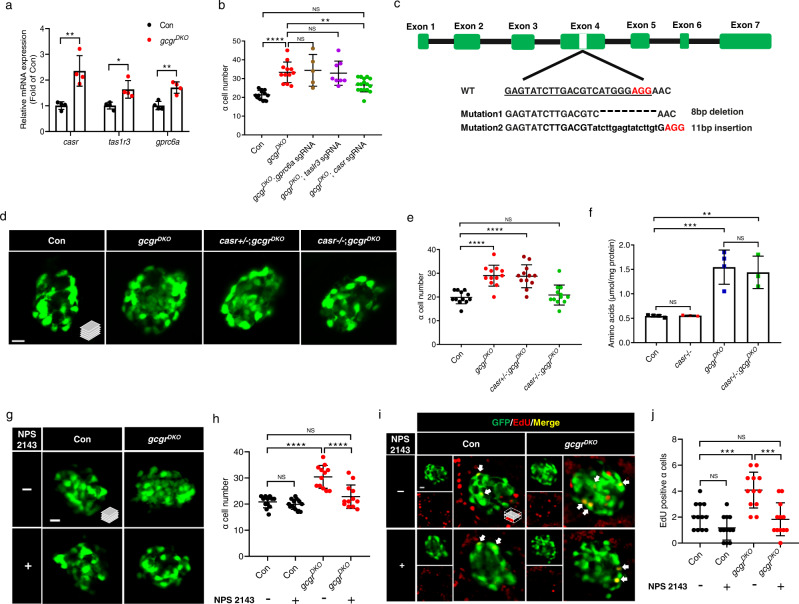
a qPCR analysis of islet amino acid sensing GPCRs (gprc6a, tas1r3, casr) (data represent the means ± SD, n = 4 for each group). b Quantification of α cell number in 5 dpf larvae of control, gcgrDKO, and gcgrDKO with knockdown of amino acid sensing GPCRs (gprc6a, tas1r3, casr) (Data represent means ± SD, n = 12, 12, 5, 8, 16 for each group). c. Diagram of casr CRISPR mutagenesis including target location, target sequence (underlined), PAM (red) and characterized mutations. Lower case letters indicate insertion. Hyphens represents deletion. d. Representative images of α cells in control, gcgrDKO, cas+/-;gcgrDKO and casr−/−;gcgrDKO larvae at 5 dpf (scale bar, 10 μm). e Quantification of α cell numbers in control, gcgrDKO, cas+/-;gcgrDKO and casr−/−;gcgrDKO larvae at 5 dpf (data represent the means ± SD, n = 12 for each group). f Free amino acid levels of control, casr−/−, gcgrDKO, and casr−/−;gcgrDKO larvae at 5 dpf, normalized by total protein concentration (data represent the means ± SD, n = 3/4, 40 fish/replicate, for each group). g Representative images of α cells in control and gcgrDKO larvae treated with 1 μM NPS 2143 or vehicle for 48 h at 5 dpf (scale bar, 10 μm). h Quantification of α cell numbers in control and gcgrDKO larvae treated with 1 μM NPS 2143 or vehicle for 48 h at 5 dpf (data represent the means ± SD, n = 12 for each group). i. Representative images of EdU staining in control and gcgrDKO larvae treated with 1 μM NPS 2143 or vehicle for 48 h at 5 dpf. EdU (red)-positive α cells are indicated by arrows (scale bar, 10 μm). j. Quantification of EdU positive α cell numbers in control and gcgrDKO larvae treated with 1 μM NPS 2143 or vehicle for 48 h at 5 dpf (data represent the means ± SD, n = 12 for each group). *P < 0.05, **P < 0.01, ***P < 0.001, ****P < 0.0001, NS means no significant difference (two-tailed unpaired t test was used for Fig. 2a. One-way ANOVA and Tukey’s multiple comparisons test were used for Fig. 2b, e, f, h and j; the quantifications represent individual islet sections). Source data are provided as a Source Data file.