
|
Fig. 1
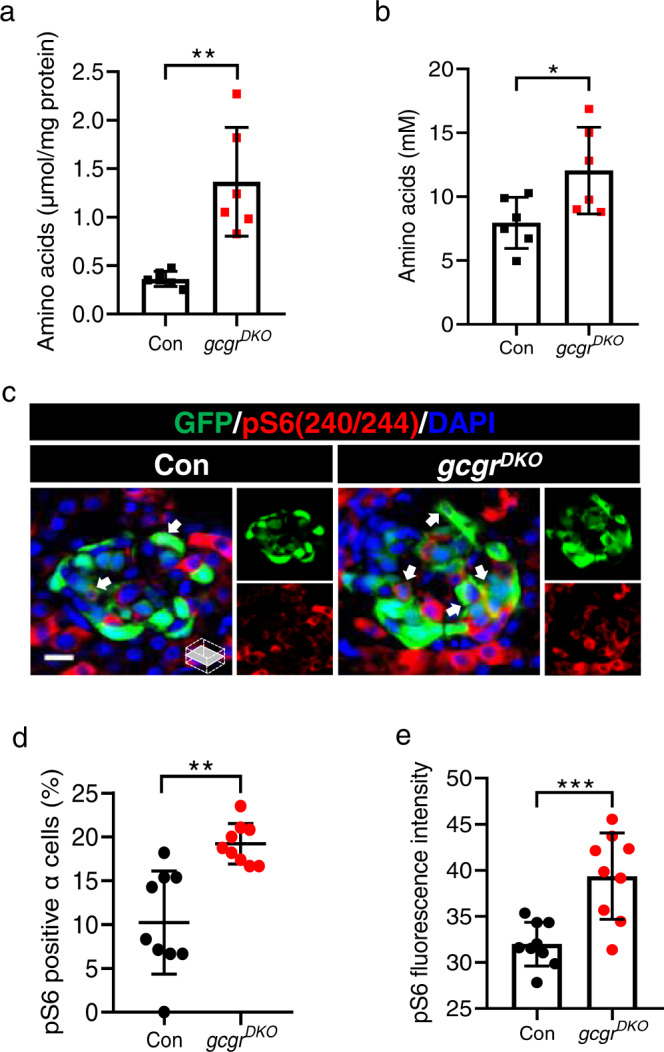
a The free amino acid levels of control and gcgrDKO larvae at 5 dpf, normalized by total protein concentration (Data represent means ± SD, n = 6, 40 fish/replicate, for each group). b Serum-free amino acid levels of control and gcgrDKO zebrafish adults (data represent the means ± SD, n = 6 for each group). c Representative images of pS6(240/244) and GFP immunofluorescence in islet sections of control and gcgrDKO larvae at 5 dpf. The pS6(240/244) signal in α cell is indicated by arrows, primary antibody: anti-pS6 (Ser240/244) (1:300, rabbit); secondary antibody: Alexa Fluor 568 (1:1000, goat anti-rabbit) (scale bar, 8 μm). d Quantification of the percentage of pS6(240/244) positive α cells in control and gcgrDKO larvae at 5 dpf (data represent the means ± SD, n = 9 for each group). e Quantification of the pS6(240/244) fluorescence intensity in α cells of control and gcgrDKO larvae at 5 dpf (data represent the means ± SD, n = 9 for each group). *P < 0.05, **P < 0.01, ***P < 0.001 (two-tailed unpaired t test, the quantifications represent individual islet sections). Source data are provided as a Source Data file.