
|
Fig. 10
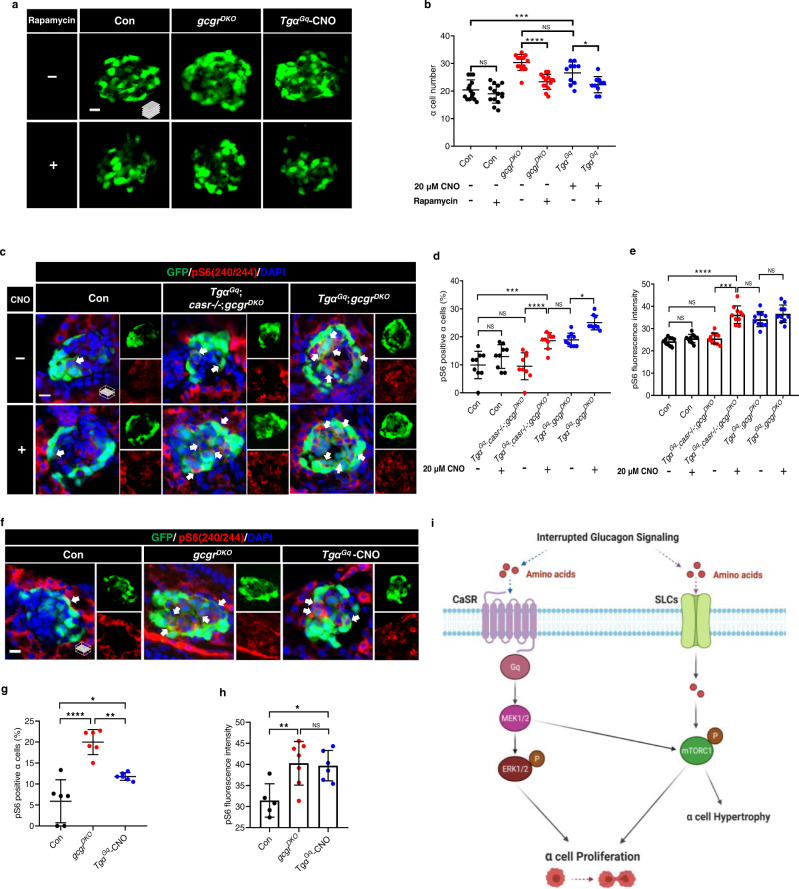
a Representative images of α cells at 5 dpf in control, gcgrDKO and TgαGq-CNO larvae treated with 2.5 μM rapamycin or vehicle for 48 h (scale bar, 10 μm). b Quantification of α cell number at 5 dpf in control, gcgrDKO and TgαGq-CNO larvae treated with o 2.5 μM rapamycin or vehicle (data represent the means ± SD, n = 14, 14, 14, 14, 10, and 10 for each group, respectively). c Representative images of pS6(240/244) and GFP immunofluorescence in islet sections of control, TgαGq;casr−/−;gcgrDKO and TgαGq;gcgrDKO at 5 dpf. The larvae were treated with 20 μM CNO or vehicle. The pS6(240/244) signal in α cell is indicated by arrows, primary antibody: Anti-pS6 (Ser240/244) (1:300, rabbit); secondary antibody: Alexa Fluor 568 (1:1000, goat anti-rabbit) (scale bar, 7 μm). d Quantification of pS6(240/244) positive α cell percentages in control, TgαGq;casr−/−;gcgrDKO and TgαGq;gcgrDKO larvae treated with 20 μM CNO or vehicle at 5 dpf (Data represent means ± SD, n = 9 for each group). e Quantification of pS6(240/244) fluorescence intensity in α cells of control, TgαGq;casr−/−;gcgrDKO and TgαGq;gcgrDKO larvae with 20 μM CNO or vehicle at 5 dpf (data represent the means ± SD, n = 10 for each group). f Representative images of pS6(240/244) and GFP immunofluorescence in islet sections of control, gcgrDKO and TgαGq with 20 μM CNO at 5 dpf. The pS6(240/244) signal in α cells is indicated by arrows, primary antibody: anti-pS6 (Ser240/244) (1:300, rabbit); secondary antibody: Alexa Fluor 568 (1:1000, goat anti-rabbit) (scale bar, 7 μm). g Quantification of pS6(240/244) positive α cell percentages in control, gcgrDKO, and TgαGq larvae treated with 20 μM CNO larvae at 5 dpf (data represent the means ± SD, n = 6 for each group). h Quantification of pS6(240/244) fluorescence intensity in α cells of control, gcgrDKO, and TgαGq with 20 μM CNO larvae at 5 dpf (data represent the means ± SD, n = 5, 7, and 6 for each group, respectively). i Working model depicting the necessary and sufficient signaling pathways for hyperaminoacidemia-induced α cell proliferation: Interrupting glucagon signaling results in hyperaminoacidemia. The amino acid surge activates the CaSR-Gq-Mek1/2-ERK1/2 pathway. Concurrently, amino acids are transported into the cytoplasm and possibly lysosomes to activate mTORC1. mTORC1 is further activated by the CaSR-Gq-Mek1/2 pathway through an as-yet-unknown mechanism. The synergism between the CaSR-Gq and mTORC1 pathways mediates hyperaminoacidemia-induced α cell proliferation. *P < 0.05, **P < 0.01, ***P < 0.001, ****P < 0.0001, NS indicates no significant difference (one-way ANOVA and Tukey’s multiple comparisons test, the quantifications represent individual islet sections). Source data are provided as a Source Data file.