
- Title
-
Bi-Allelic Mutations in Zebrafish pank2 Gene Lead to Testicular Atrophy and Perturbed Behavior without Signs of Neurodegeneration
- Authors
- Mignani, L., Zizioli, D., Khatri, D., Facchinello, N., Schiavone, M., De Palma, G., Finazzi, D.
- Source
- Full text @ Int. J. Mol. Sci.

ZFIN is incorporating published figure images and captions as part of an ongoing project. Figures from some publications have not yet been curated, or are not available for display because of copyright restrictions. PHENOTYPE:
|
|
ZFIN is incorporating published figure images and captions as part of an ongoing project. Figures from some publications have not yet been curated, or are not available for display because of copyright restrictions. PHENOTYPE:
|
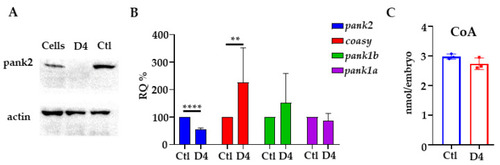
Molecular characterization of D4 mutant embryos. (A) Western blot for Pank2 in mutant (D4) and control embryos (Ctl). Lysates from SH-SY5Y cells (Cells) were run as controls. (B) qPCR analysis on mutant and control embryos for pank2, coasy, pank1a, and pank1b. (C) Coenzyme A quantification by a fluorimetric assay. Data derived from the analysis of 20 embryos/group, with two biological replicates for Western blotting and at least three for qPCR and CoA quantification. ** p < 0.01; **** p < 0.0001, Student’s t-test. |
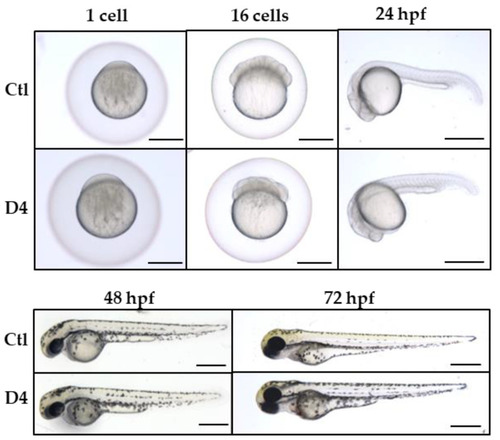
Morphological characterization of D4 mutant embryos. Comparison of the morphological features of control and mutant embryos from 1 hpf till 3 dpf. Three biological replicates, N > 100 for Ctl and D4. Size bar = 500 µm. PHENOTYPE:
|
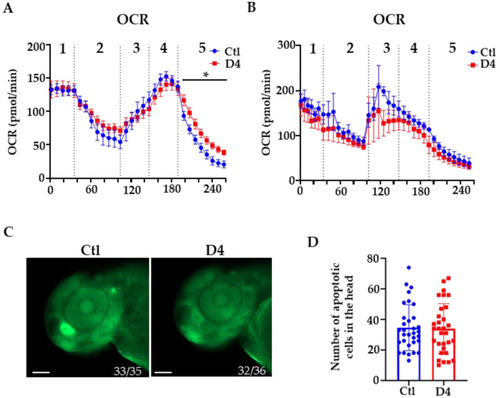
Oxygen consumption rate (OCR) and cell death analysis. (A) Oxygen consumption rate (OCR) in control (Ctl) and mutant (D4) embryos at 48 hpf (Ctl N = 9; D4 N = 10) and (B) at 72 hpf (Ctl N = 9; D4 N = 10). 1 = basal rate; 2 = 10 μM oligomycin, 3 = 1 μM FCCP; 4 = 2 μM FCCP; 5 = 1 μM rotenone and antimycin A. * p < 0.05, Student’s t-test. (C) Lateral view of acridine orange stained embryos at 48 hpf. The numbers at the bottom of the images indicate the ratio between embryos with the observed phenotype and the total number of stained embryos. Size bar = 100 µm. (D) Quantification of acridine orange positive cells in the brain region (Ctl N = 33, D4 N = 32; two biological replicates). PHENOTYPE:
|
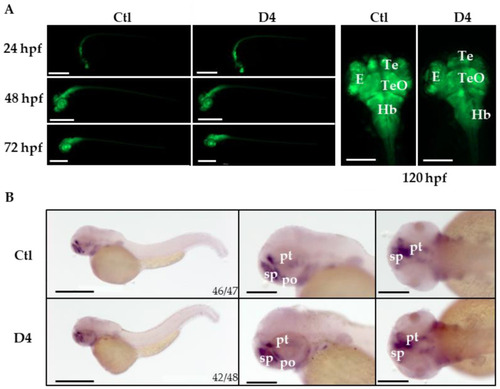
Neuronal characterization of control and mutant embryos. (A) Representative images of control and mutant Tg(neurod1:EGFP) embryos at different stages of development. Size bar = 500 and 200 µm. The analysis was performed in 3 experiments, and more than 100 embryos were analyzed in total per group. (B) Whole-mount in situ hybridization for dlx2a performed in embryos at 48 hpf. The experiment was performed twice. The numbers at the bottom of the images indicate the ratio between embryos with the observed phenotype and the total number of stained embryos. Size bar = 500 and 200 µm. E, eye; Hb, hindbrain; Ob, olfactory bulb; Te, telencephalon; TeO, tectum opticum; pt, prethalamus; po, preoptic area; sp, subpallium. EXPRESSION / LABELING:
|

Effects of the absence of pank2 on vasculature development. (A) Measurement of the venous return in embryos at 24 hpf; the blue line indicates the length of the caudal vein, and the red line is that of the tail. The measurement was expressed as the ratio between the two values (percentage). (B) The graph in the panel shows the mean values obtained in control and mutant embryos (Ctl = 51.6%; D4 = 47.9%). The experiment was repeated twice on 36 embryos/group. * p < 0.05, Student’s t-test. (C) Representative images of the phosphatase assay for vessel visualization on 72 hpf embryos. The red line decorates the dorsal aorta; the blue one is the caudal plexus. The numbers at the bottom of the images indicate the ratio between embryos with the observed phenotype and the total number of stained embryos. The experiment was performed 3 times on at least 60 embryos/group. Size bar = 500 µm. PHENOTYPE:
|

Primordial germ line and testis evaluation. (A) WISH for nanos3 in 24 hpf embryos. Size bar = 500 µm and 200 µm. (B) Quantification of nanos3 positive cells in control (Ctl) and D4 embryos (Ctl mean = 8.18 N = 83; D4 mean = 5.07 N = 85, **** p < 0.0001, Student’s t-test). (C) Representative histological sagittal sections of 1-year-old fish, stained with hematoxylin-eosin. Red circle indicates the testis. N = 5 for each group. Magnification 10× and 40×. Size bar = 2000 µm and 500 µm (D) Quantification of testis area performed on histological sections; Ctl mean = 0.92 mm2; D4 mean = 0.24 mm2 ** p < 0.01, Mann–Whitney U test. |
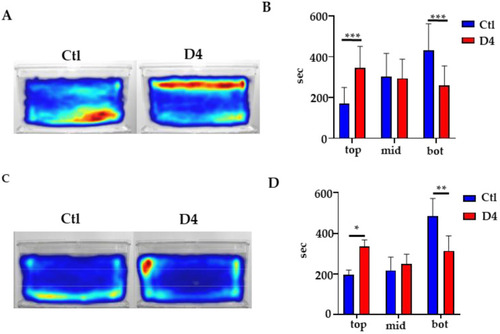
Behavioral analysis in adult fish. (A) Heat map visualization of the cumulative track of 1-year-old fish obtained with Noldus EthoVision software. (B) Quantification of the time spent in the top (top), middle (mid), and bottom (bot) part of the tank by 1-year-old fish; N = 11 for Ctl and 12 for D4 *** p < 0.001, ANOVA with Sidak’s correction for multiple comparisons. (C) Heat map visualization of the cumulative track of 3-month-old fish obtained with Noldus EthoVision software. (D) Quantification of the time spent in different sections of the tank (top, mid, and bot) by 3-month-old fish; N = 3, * p < 0.05, ** p < 0.01, ANOVA with Sidak’s correction for multiple comparisons. PHENOTYPE:
|