
|
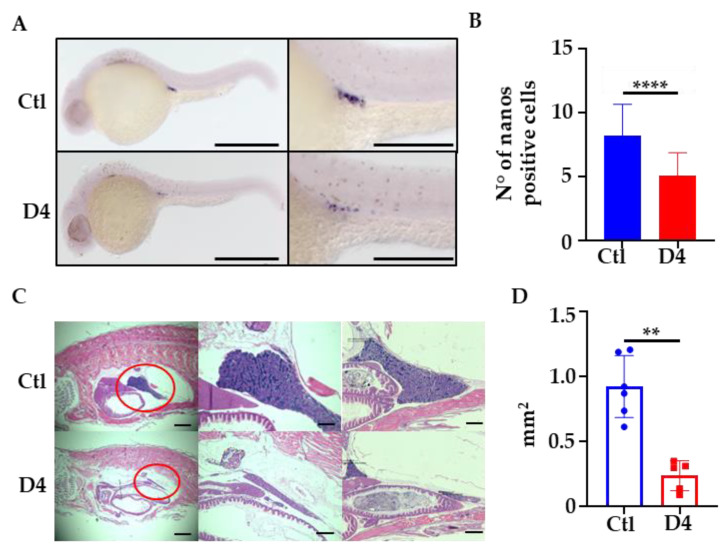
Figure 6
Primordial germ line and testis evaluation. (A) WISH for nanos3 in 24 hpf embryos. Size bar = 500 µm and 200 µm. (B) Quantification of nanos3 positive cells in control (Ctl) and D4 embryos (Ctl mean = 8.18 N = 83; D4 mean = 5.07 N = 85, **** p < 0.0001, Student’s t-test). (C) Representative histological sagittal sections of 1-year-old fish, stained with hematoxylin-eosin. Red circle indicates the testis. N = 5 for each group. Magnification 10× and 40×. Size bar = 2000 µm and 500 µm (D) Quantification of testis area performed on histological sections; Ctl mean = 0.92 mm2; D4 mean = 0.24 mm2 ** p < 0.01, Mann–Whitney U test.