
|
Figure 3
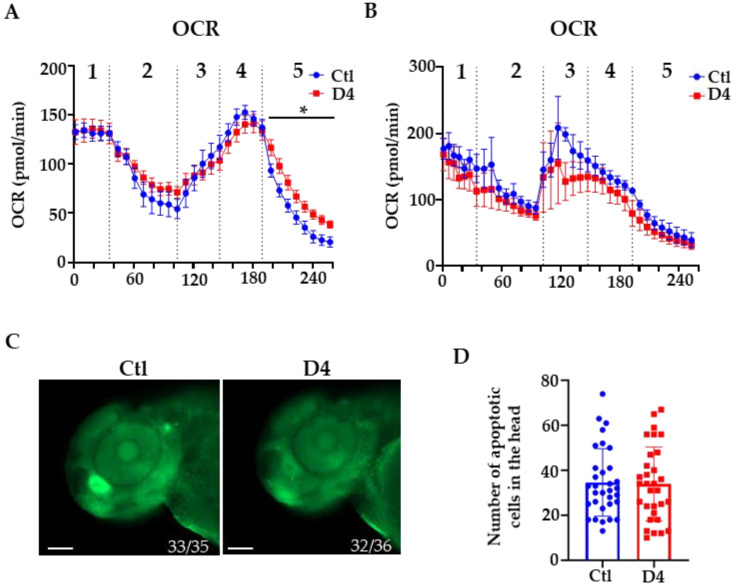
Oxygen consumption rate (OCR) and cell death analysis. (A) Oxygen consumption rate (OCR) in control (Ctl) and mutant (D4) embryos at 48 hpf (Ctl N = 9; D4 N = 10) and (B) at 72 hpf (Ctl N = 9; D4 N = 10). 1 = basal rate; 2 = 10 μM oligomycin, 3 = 1 μM FCCP; 4 = 2 μM FCCP; 5 = 1 μM rotenone and antimycin A. * p < 0.05, Student’s t-test. (C) Lateral view of acridine orange stained embryos at 48 hpf. The numbers at the bottom of the images indicate the ratio between embryos with the observed phenotype and the total number of stained embryos. Size bar = 100 µm. (D) Quantification of acridine orange positive cells in the brain region (Ctl N = 33, D4 N = 32; two biological replicates).