
Image
|
Figure Caption
Figure 1
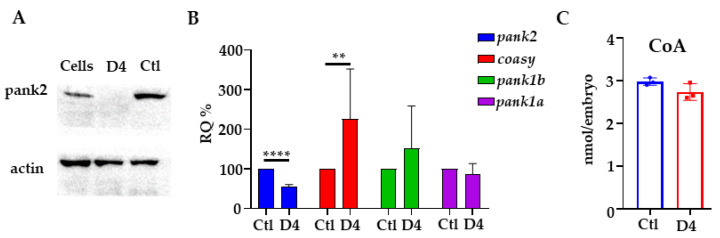
Molecular characterization of D4 mutant embryos. (A) Western blot for Pank2 in mutant (D4) and control embryos (Ctl). Lysates from SH-SY5Y cells (Cells) were run as controls. (B) qPCR analysis on mutant and control embryos for pank2, coasy, pank1a, and pank1b. (C) Coenzyme A quantification by a fluorimetric assay. Data derived from the analysis of 20 embryos/group, with two biological replicates for Western blotting and at least three for qPCR and CoA quantification. ** p < 0.01; **** p < 0.0001, Student’s t-test.
Figure Data
Acknowledgments
This image is the copyrighted work of the attributed author or publisher, and
ZFIN has permission only to display this image to its users.
Additional permissions should be obtained from the applicable author or publisher of the image.
Full text @ Int. J. Mol. Sci.