
|
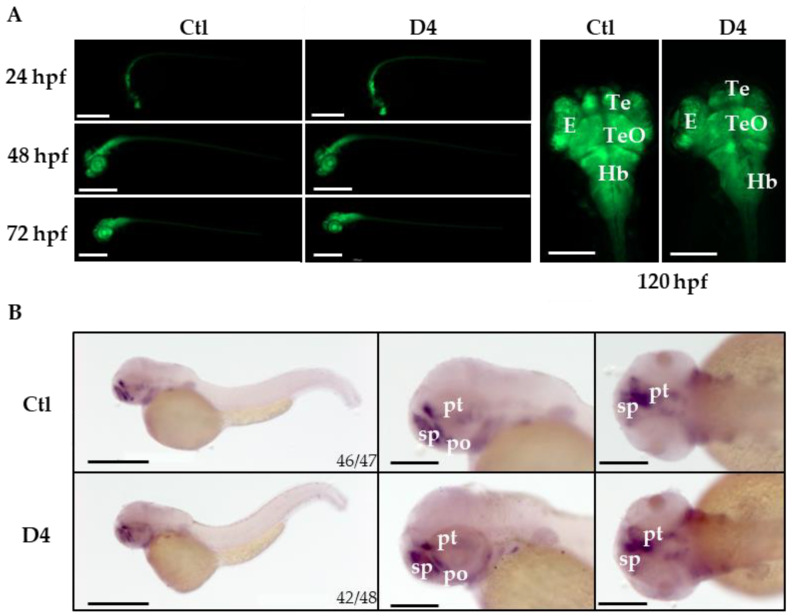
Figure 4
Neuronal characterization of control and mutant embryos. (A) Representative images of control and mutant Tg(neurod1:EGFP) embryos at different stages of development. Size bar = 500 and 200 µm. The analysis was performed in 3 experiments, and more than 100 embryos were analyzed in total per group. (B) Whole-mount in situ hybridization for dlx2a performed in embryos at 48 hpf. The experiment was performed twice. The numbers at the bottom of the images indicate the ratio between embryos with the observed phenotype and the total number of stained embryos. Size bar = 500 and 200 µm. E, eye; Hb, hindbrain; Ob, olfactory bulb; Te, telencephalon; TeO, tectum opticum; pt, prethalamus; po, preoptic area; sp, subpallium.