
- Title
-
Identifying the transcriptional drivers of metastasis embedded within localized melanoma
- Authors
- Suresh, S., Rabbie, R., Garg, M., Lumaquin, D., Huang, T.H., Montal, E., Ma, Y., Cruz, N.M., Tang, X., Nsengimana, J., Newton-Bishop, J., Hunter, M.V., Zhu, Y., Chen, K., de Stanchina, E., Adams, D.J., White, R.M.
- Source
- Full text @ Cancer Discov
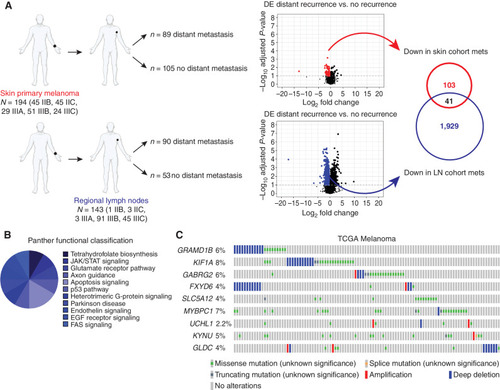
The AVAST-M trial identifies a signature predictive of metastatic relapse. A, Schematic showing the DE analysis resulting in the 41 downregulated genes associated with distant recurrence from the AVAST-M trial. The covariate-corrected DE analysis compared distant recurrence vs. no distant recurrence and was undertaken separately on primary melanomas (n = 194) and regional lymph node (LN) tumors (n = 143). Volcano plot showing, for each gene, the −log10 FDR-corrected P value (y-axis) and the corresponding log-fold change estimate within the DE analysis (x-axis). The (predominant) downregulated genes with an FDR-corrected P < 0.1 are color-coded (red dots indicate genes derived from skin primary melanomas; blue dots indicate genes derived from regional lymph node tumors). The intersecting (41) downregulated genes were selected for further testing. List of genes in Supplementary Table S1. mets, metastases. B, PANTHER pathway analysis of AVAST-M genes represented as a pie graph. C, Alteration frequency of candidate genes in the TCGA melanoma cohort (Firehose Legacy, n = 287). Top altered genes are plotted to display deep deletions, missense mutations, and amplifications. |
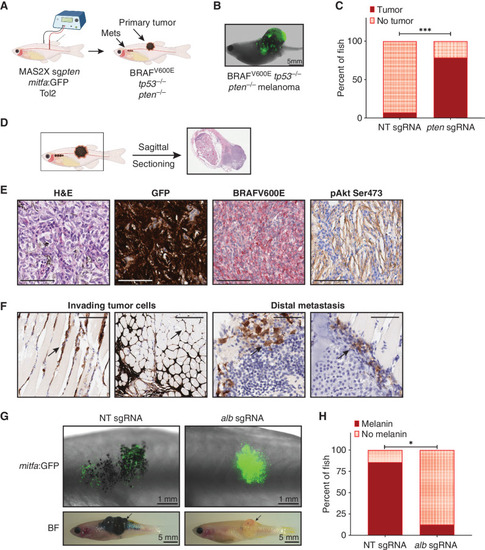
A TEAZ platform to screen for metastasis modulators in vivo. A, Generation of a baseline BRAFV600E tp53−/−pten−/− metastatic melanoma model using TEAZ. MAZERATI 2X (MAS2X) sgpten plasmid was coelectroporated with a mitfa:GFP plasmid to generate loss of pten in a melanocyte-specific manner. mets, metastases. B, Representative fluorescent image of an adult zebrafish with a BRAFV600E tp53−/−pten−/− tumor 16 weeks after TEAZ. C, Quantification of tumor incidence in animals expressing a nontargeting (NT) sgRNA or pten sgRNAs represented as percent of fish with tumors. Fisher two-sided t test was performed on data from n = 3 independent experiments. ***, P = 0.003. D, Sagittal sectioning of animals with melanomas for IHC. E, Histology of BRAFV600E tp53−/−pten−/− melanomas demonstrating tumor cell expression of GFP, BRAFV600E, and activated Akt signaling. Scale bar, 60 μm. H&E, hematoxylin and eosin. F, IHC staining for GFP in muscle (left images) and kidney marrow (right images) of animals bearing BRAFV600E tp53−/−pten−/− showing the presence of invading tumor cells (scale bar, 100 μm) and distal metastasis (scale bar, 60 μm), respectively. Arrows indicate metastatic tumor cells. G, Representative images of animals with NT or alb KO melanomas at 6 weeks after TEAZ (top, fluorescent GFP imaging at 25×) and 12 weeks after TEAZ (bottom, brightfield image at 3.5×). Tumor is indicated by a black arrow in each group. Scale bar on the graph. BF, Brightfield. H, Quantification of the presence of melanin in animals expressing a NT sgRNA or alb sgRNAs represented as percent of fish with melanin. Fisher two-sided t test was performed on data from n = 3 independent experiments. *, P < 0.05. |
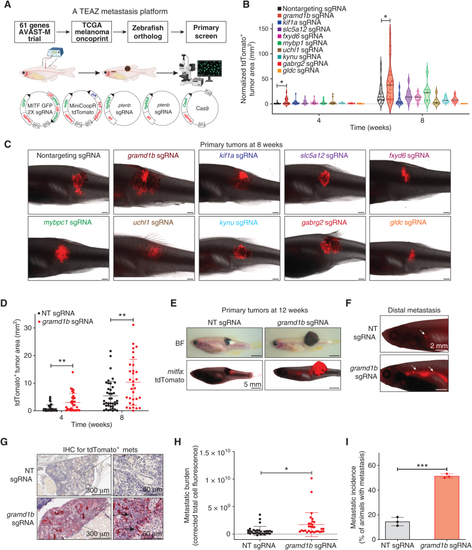
An in vivo screen identifies GRAMD1B as a metastasis suppressor in melanoma. A, Strategy for in vivo metastasis screen. Zebrafish orthologs for candidate genes were obtained and MITF GFP 2X sgRNA pools expressing 4 sgRNAs per candidate were co-electroporated with the multiplasmid mix to induce metastatic melanoma. Candidates from the primary screen were assessed for their ability to modulate metastasis via fluorescent imaging of areas separate from the primary tumor. See Methods for details. B, Quantification of tdTomato+ primary tumor area in animals expressing nontargeting (NT) sgRNA or sgRNA pools against candidates at 4 and 8 weeks after TEAZ. Data were obtained from n = 3 independent experiments, and all data points were normalized to NT sgRNA tumors at week 4. Error bars, SD; Mann–Whitney test was used to compare ranks between tumor area of candidates vs. NT sgRNA at each time point. *, P = 0.013. C, Representative images showing tdTomato+ melanomas from animals expressing a NT sgRNA or candidate sgRNAs at 8 weeks after TEAZ. Scale bar, 1 mm.D, Quantification of tdTomato+ primary tumor area in a validation cohort of animals expressing NT sgRNA or gramd1b sgRNAs at 4 and 8 weeks after TEAZ. Data are pooled from n = 4 independent experiments. Error bars, SD; Mann–Whitney test was used to compare ranks between tumor areas of gramd1b sgRNA vs. NT sgRNA at each time point to obtain; **, P = 0.001 at 4 weeks; **, P = 0.007 at 8 weeks. E, Representative brightfield and fluorescent images for tdTomato showing animals bearing tumors expressing NT sgRNA or gramd1b sgRNAs at 12 weeks after TEAZ. Scale bar, 5 mm. BF, Brightfield. F, Representative fluorescent image of tdTomato+ distal metastasis (white arrows indicate metastatic cells) in the kidney marrow of animals expressing NT or gramd1b sgRNAs. Scale bar, 2 mm. G, IHC validation of tdTomato+ metastatic tumor cells (black arrows) in kidney marrow of an animal expressing gramd1b sgRNAs. Scale bars indicated on image. mets, metastases. H, Quantification of metastatic burden in animals expressing NT or gramd1b sgRNAs represented as corrected total cell fluorescence (integrated density, sum of values of tdTomato pixels in image) at 12 weeks after TEAZ. Data are pooled from n = 4 independent experiments. Error bars, SD; Welch t test was used to test statistical significance. *, P = 0.0122. I, Quantification of metastatic incidence in animals with NT or gramd1b KO melanomas expressed as % of fish with metastasis at 12 weeks after TEAZ. Data are pooled from n = 4 independent experiments. Error bars, SD; Welch t test was used to assess statistical significance. ***, P = 0.0005. |
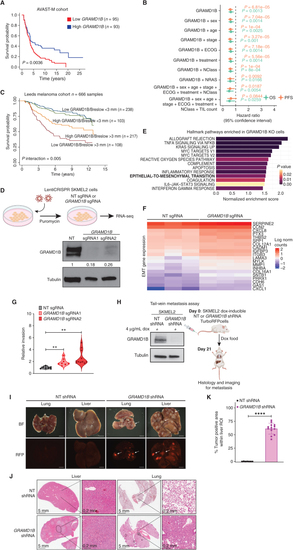
GRAMD1B is a metastasis suppressor in human melanoma. A, Kaplan–Meier survival plots comparing overall survival (OS) probabilities (Y-axis) as a function of time in years (x-axis) in patients with low (n = 95) and high (n = 93) GRAMD1B expression based on median GRAMD1B expression split in the AVAST-M melanoma cohort. A log-rank test comparing the survival distributions of both groups is indicated with a P value. B, Forest plot indicating the hazard ratio (HR) estimates related to GRAMD1B expression when predicting OS (green) and progression-free survival (PFS; orange) by means of Cox proportional hazard models controlling for different clinical variables (y-axis) in the AVAST-M melanoma cohort (n = 194). The HR estimates are indicated by the dots at the center of the error bars; the horizontal error bars correspond to the 95% confidence intervals of the HR. The two-sided Wald t test P values corresponding to GRAMD1B expression are indicated for each model and outcome. Sex (male or female), age (as a continuous variable), stage (IIB, IIC, IIIA, IIIB, or IIIC), ECOG; Eastern Cooperative Oncology Group Performance Status (0 or 1), treatment (bevacizumab or placebo), NClass (N0, N1, N2, or N3), NRAS mutation (mutant or wild-type); TIL count, tumor-infiltrating lymphocyte count (brisk, nonbrisk or absent). C, Kaplan–Meier plot for melanoma-specific survival in patients with low and high GRAMD1B expression (split on median) and Breslow thickness (split at 3 mm). There is a significant interaction (P = 0.005) between the two factors in Cox proportional hazards risk regression. The difference between the two bottom curves has an HR of 0.56 (95% CI, 0.38–0.83). D, Generation of SKMEL2 cells expressing nontargeting (NT) sgRNA and GRAMD1B sgRNA for bulk RNA-seq. RNA-seq was performed on n = 3 biological replicates per experimental group (top). Bottom, Western blot analysis of GRAMD1B in SKMEL2 cells expressing an NT sgRNA or 2 independent sgRNAs against GRAMD1B. Tubulin served as a loading control in this and all subsequent western blots. Quantification of GRAMD1B normalized to Tubulin and relative to NT sgRNA are in black text below the blot. E, Bar graph depicting top Hallmark pathways enriched in GRAMD1B KO cells plotted against the normalized enrichment score. An FDR cutoff of 0.1 was used for multiple hypothesis testing, and pathways are ranked by nominal P value.F, Heat map depicting differential upregulation of EMT genes in GRAMD1B KO cells. Log2 normalized counts of genes involved in the EMT pathway (FDR q = 0.028) are rescaled and plotted for NT and GRAMD1B sgRNA samples, n = 3 biological replicates per group. G, Quantification of invasiveness of GRAMD1B KO SKMEL2 cells relative to NT cells. Data represent fold change in invasion and pooled from n = 3 independent experiments. Invasiveness was calculated by normalizing Calcein fluorescence to the NT group. See Methods for details. Error bars, SD; two-tailed t test was used to assess statistical significance. **, P = 0.001 for GRAMD1B sgRNA1 vs. NT; **, P = 0.002 for GRAMD1B sgRNA2 vs. NT. H, Schematic for generation of dox-inducible shRNA cells for the tail-vein metastasis assay in mice. Left, western blot analysis of GRAMD1B in SKMEL2 cells expressing an NT shRNA or GRAMD1B shRNA and treated with dox for 4 days. Right, schematic of tail-vein metastasis assay using these shRNA cells. I, Brightfield and fluorescent (RFP) images of lung and liver tissues imaged at 6 × 3 weeks after tail-vein injection of NT or GRAMD1B shRNA SKMEL2 cells. White arrows represent metastatic tumor cells. BF, Brightfield. J, Histology of mouse lung and liver tissues from mice injected with NT or GRAMD1B shRNA SKMEL2 cells. Scale bars, 5 mm or 0.2 mm. K, Quantification of metastatic burden in livers of mice injected with NT or GRAMD1B shRNA SKMEL2 cells, represented as % tumor-positive liver area. n = 2 animals per group, with 4–5 regions of interest (ROI) per liver lobe. Error bars, SD; Welch t test was used to assess statistical significance. ****, P < 0.00001. |
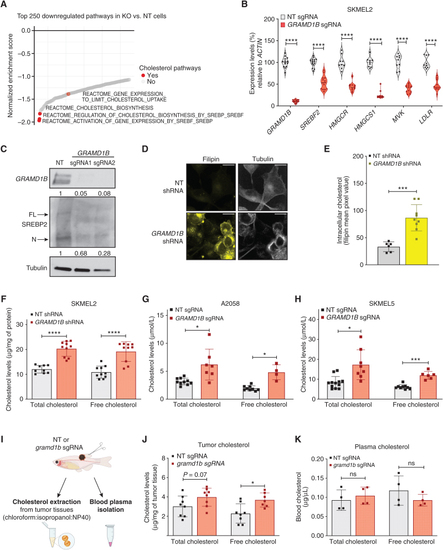
GRAMD1B loss leads to cholesterol overload in melanoma cells. A, Waterfall plot depicting top 250 downregulated pathways in GRAMD1B KO cells plotted against their normalized enrichment score. Cholesterol-related pathways are highlighted in red. B, Real-time PCR quantification of cholesterol synthesis genes in nontargeting (NT) and GRAMD1B KO cells. Violin plots represent the expression of genes (in %) relative to ACTIN. Data are pooled from n = 3 independent experiments. Error bars, SD; Welch t test was used to assess statistical significance. ****, P < 0.00001. C, Western blot analysis of full-length (FL) and nuclear (N) SREBP2 in whole-cell lysates from SKMEL2 cells expressing NT or GRAMD1B sgRNAs. Quantification of GRAMD1B and nuclear SREBP2 are shown below the blot. D, Representative confocal microscopy image of Filipin staining in SKMEL2 cells expressing an NT or GRAMD1B shRNA demonstrating elevated free cholesterol within GRAMD1B knockdown cells. Scale bar, 13 µm. E, Quantification of intracellular free cholesterol in NT and GRAMD1B shRNA cells represented as mean pixel value of Filipin intensity. Data are from n = 3 independent experiments. Error bars, SD; Welch t test was used to assess statistical significance. ***, P = 0.0009.F, Total and free cholesterol levels normalized to total protein (μg/mg) in NT and GRAMD1B shRNA SKMEL2 cells. Data are pooled from n = 3 independent experiments. Error bars, SD; Welch t test was used to assess statistical significance. ****, P < 0.0001. G, Total and free cholesterol levels normalized to total viable cells (μmol/L) in NT and GRAMD1B KO A2058 cells. Data are pooled from n = 3 independent experiments. Error bars, SD; Welch t test was used to assess statistical significance. *, P < 0.05. H, Total and free cholesterol levels normalized to total viable cells (μmol/L) in NT and GRAMD1B KO SKMEL5 cells. Data are pooled from n = 3 independent experiments. Error bars, SD; Welch t test was used to assess statistical significance. *, P < 0.05; ***, P < 0.001. I, Schematic of extraction of blood and tumor cholesterol from animals bearing NT or gramd1b KO tumors. Tumor cholesterol was extracted from primary tumor tissues in chloroform:isopropanol:NP40. See Methods for details. J, Total and free cholesterol levels normalized to tumor weight (mg) in NT or gramd1b KO tumors. Data are representative of n = 4 independent animals per group, measured in duplicates. Error bars, SD; Welch t test was used to assess statistical significance. *, P < 0.05. K, Total and free blood cholesterol levels in animals bearing NT or gramd1b KO tumors. Data are representative of n = 4 independent animals per group. Error bars, SD; Welch t test was used to assess statistical significance. *, P < 0.05. |
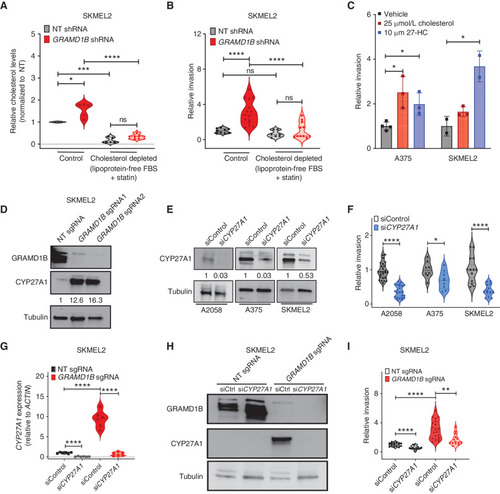
Free cholesterol and 27-hydroxycholesterol promote tumor invasion under GRAMD1B loss. A, Quantification of relative cholesterol levels (represented as fold change and normalized to NT cells) in SKMEL2 NT and GRAMD1B shRNA cells cultured in control media or cholesterol-depleted media. To deplete cholesterol, cells were grown in media containing 10% lipoprotein-free FBS and Simvastatin for 48 hours. See Methods for details. Data are pooled from n = 3 independent experiments; error bars, SD; Welch t test was used to assess statistical significance. *, P = 0.018; ***, P = 0.0005; ****, P < 0.0001. B, Quantification of relative invasion in cells from A. The number of fluorescent cells in the bottom chamber was quantified and normalized to the NT group to obtain relative invasion. Data are pooled from n = 3 independent experiments; error bars, SD; Welch t test was used to assess statistical significance. ***, P = 0.0001; ****, P < 0.0001. C, Quantification of relative invasion (represented as fold change and normalized to vehicle) in A375 and SKMEL2 cells treated with cholesterol (25 μmol/L) or 27-hydroxycholesterol (27-HC, 10 μmol/L) for 48 hours. The number of fluorescent cells in the bottom chamber was quantified and normalized to the vehicle group to obtain relative invasion. Data are pooled from n = 3 independent experiments; error bars, SD; Welch t test was used to assess statistical significance. *, P < 0.05. D, Western blot analysis of CYP27A1 and GRAMD1B in SKMEL2 NT and GRAMD1B KO cells. CYP27A1 levels normalized to Tubulin are in black text below the blot. E, Western blot analysis of CYP27A1 in A2058, A375, and SKMEL2 cells transfected with control siRNA or CYP27A1 siRNA. CYP27A1 levels normalized to Tubulin are in black text below the blot. F, Relative invasion of A2058, A375, and SKMEL2 cells transfected with control siRNA or CYP27A1 siRNA. The number of fluorescent cells in the bottom chamber was quantified and normalized to control cells to obtain relative invasion. Data are pooled from n = 3 independent experiments; error bars, SD; Welch t test was used to assess statistical significance. *, P < 0.05; ****, P < 0.0001. G, Real-time PCR analysis of CYP27A1 in SKMEL2 NT and GRAMD1B KO cells transfected with control siRNA or CYP27A1 siRNA. Data are pooled from n = 3 independent experiments; error bars, SD; Welch t test was used to assess statistical significance. ****, P < 0.0001. H, Western blot analysis of CYP27A1 and GRAMD1B in SKMEL2 nontargeting (NT) and GRAMD1B KO cells transfected with control siRNA or CYP27A1 siRNA. I, Relative invasion of SKMEL2 NT and GRAMD1B KO cells transfected with control siRNA or CYP27A1 siRNA. Data are pooled from n = 3 independent experiments; error bars, SD; Welch t test was used to assess statistical significance. ****, P < 0.0001; **, P < 0.01. |
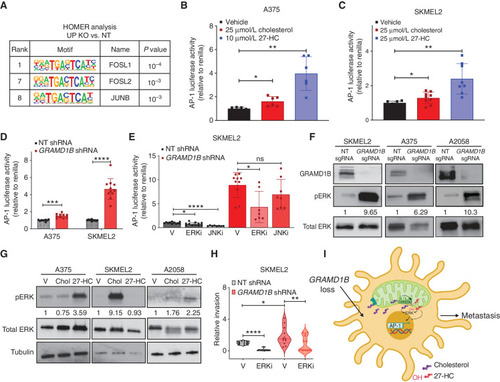
Sterol overload activates AP-1 via ERK signaling to mediate invasion upon GRAMD1B loss in melanoma. A, HOMER analysis of top motifs enriched in genes upregulated in GRAMD1B KO cells. Motifs related to the AP-1 complex are highlighted in the table along with rank and P value. Dual reporter analysis of AP-1 luciferase reporter activity in A375 cells treated with 25 μmol/L cholesterol or 10 μmol/L 27-HC for 48 hours. Firefly AP-1 luciferase activity was normalized to Renilla luciferase and relative luciferase activity is plot normalized to vehicle. Data are pooled from n = 3 independent experiments. Error bars, SD; Welch t test was performed to assess statistical significance. *, P = 0.01; **, P = 0.001. C, Dual reporter analysis of AP-1 luciferase reporter activity in SKMEL2 cells treated with 25 μmol/L cholesterol or 25 μmol/L 27-HC for 48 hours. Firefly AP-1 luciferase activity was normalized to Renilla luciferase and relative luciferase activity is plot normalized to vehicle. Data are pooled from n = 3 independent experiments. Error bars, SD; Welch t test was performed to assess statistical significance. *, P = 0.04,**, P = 0.002. D, Dual reporter analysis of AP-1 luciferase reporter activity in A375 and SKMEL2 nontargeting (NT) or GRAMD1B knockdown cells. Firefly AP-1 luciferase activity was normalized to Renilla luciferase and relative luciferase activity is plot normalized to NT shRNA. Data are pooled from n = 3 independent experiments. Error bars, SD, a Welch t test was performed to assess statistical significance. ***, P = 0.0003; ****, P = 0.000038. E, Dual reporter analysis of AP-1 luciferase reporter activity in SKMEL2 NT or GRAMD1B knockdown cells treated with DMSO (vehicle), 200 nmol/L JNKi or 200 nmol/L ERKi for 48 hours. Firefly AP-1 luciferase activity was normalized to Renilla luciferase and relative luciferase activity is plot normalized to NT shRNA (vehicle). Data are pooled from n = 3 independent experiments. Error bars, SD; Welch t test was performed to assess statistical significance. *, P = 0.01; ****, P < 0.000001. V, vehicle. F, Western blots depicting phosphorylation of ERK1/2 in SKMEL2, A375, and A2058 cells expressing NT or GRAMD1B sgRNAs. Data are representative of n = 2–3 independent experiments. Quantification of phosphorylated ERK protein levels relative to total ERK in black text below the blot. G, Western blots depicting phosphorylation of ERK1/2 in A375, SKMEL2, and A2058 cells stimulated with cholesterol or 27-HC for 48 hours. Data are representative of n = 2 independent experiments. Quantification of phosphorylated ERK protein levels relative to total ERK in black text below the blot. H, Quantification of relative invasion in SKMEL2 cells expressing NT or GRAMD1B shRNA treated with 100 nmol/L ERKi for 24 hours. The number of Hoechst+ cells in the bottom chamber in each group was normalized to the NT group to obtain relative invasion. See Methods for details. Data are pooled from n = 3 independent experiments. Error bars, SD; Welch t test was performed. *, P < 0.05; **, P < 0.01; ****, P < 0.0001. I, Working model of prometastatic functions of GRAMD1B loss in melanoma. GRAMD1B loss results in free cholesterol, some of which may move into the mitochondria, where it is converted to 27-HC. Free sterols induce ERK signaling to activate the AP-1 complex and mediate an invasion transcriptional program in melanoma to promote metastasis. |