
Fig. 1
- ID
- ZDB-FIG-230613-141
- Publication
- Suresh et al., 2022 - Identifying the transcriptional drivers of metastasis embedded within localized melanoma
- Other Figures
- All Figure Page
- Back to All Figure Page
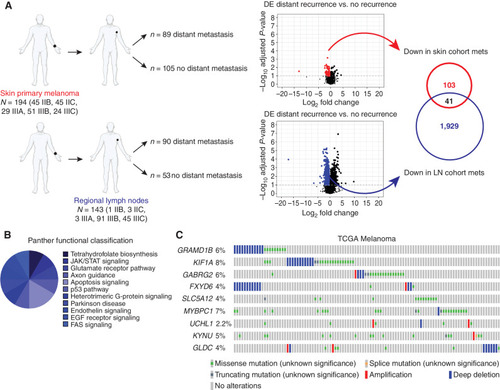
The AVAST-M trial identifies a signature predictive of metastatic relapse. A, Schematic showing the DE analysis resulting in the 41 downregulated genes associated with distant recurrence from the AVAST-M trial. The covariate-corrected DE analysis compared distant recurrence vs. no distant recurrence and was undertaken separately on primary melanomas (n = 194) and regional lymph node (LN) tumors (n = 143). Volcano plot showing, for each gene, the −log10 FDR-corrected P value (y-axis) and the corresponding log-fold change estimate within the DE analysis (x-axis). The (predominant) downregulated genes with an FDR-corrected P < 0.1 are color-coded (red dots indicate genes derived from skin primary melanomas; blue dots indicate genes derived from regional lymph node tumors). The intersecting (41) downregulated genes were selected for further testing. List of genes in Supplementary Table S1. mets, metastases. B, PANTHER pathway analysis of AVAST-M genes represented as a pie graph. C, Alteration frequency of candidate genes in the TCGA melanoma cohort (Firehose Legacy, n = 287). Top altered genes are plotted to display deep deletions, missense mutations, and amplifications. |