
Fig. 5
- ID
- ZDB-FIG-230613-145
- Publication
- Suresh et al., 2022 - Identifying the transcriptional drivers of metastasis embedded within localized melanoma
- Other Figures
- All Figure Page
- Back to All Figure Page
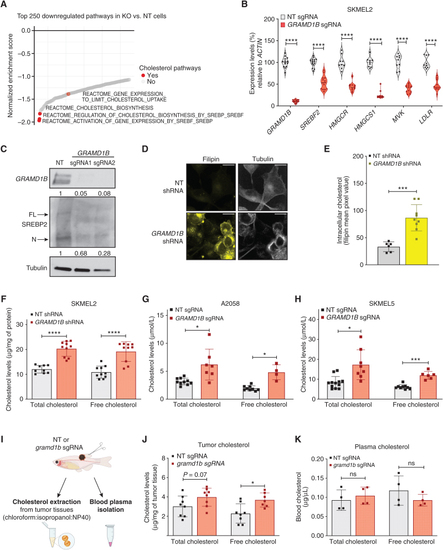
GRAMD1B loss leads to cholesterol overload in melanoma cells. A, Waterfall plot depicting top 250 downregulated pathways in GRAMD1B KO cells plotted against their normalized enrichment score. Cholesterol-related pathways are highlighted in red. B, Real-time PCR quantification of cholesterol synthesis genes in nontargeting (NT) and GRAMD1B KO cells. Violin plots represent the expression of genes (in %) relative to ACTIN. Data are pooled from n = 3 independent experiments. Error bars, SD; Welch t test was used to assess statistical significance. ****, P < 0.00001. C, Western blot analysis of full-length (FL) and nuclear (N) SREBP2 in whole-cell lysates from SKMEL2 cells expressing NT or GRAMD1B sgRNAs. Quantification of GRAMD1B and nuclear SREBP2 are shown below the blot. D, Representative confocal microscopy image of Filipin staining in SKMEL2 cells expressing an NT or GRAMD1B shRNA demonstrating elevated free cholesterol within GRAMD1B knockdown cells. Scale bar, 13 µm. E, Quantification of intracellular free cholesterol in NT and GRAMD1B shRNA cells represented as mean pixel value of Filipin intensity. Data are from n = 3 independent experiments. Error bars, SD; Welch t test was used to assess statistical significance. ***, P = 0.0009.F, Total and free cholesterol levels normalized to total protein (μg/mg) in NT and GRAMD1B shRNA SKMEL2 cells. Data are pooled from n = 3 independent experiments. Error bars, SD; Welch t test was used to assess statistical significance. ****, P < 0.0001. G, Total and free cholesterol levels normalized to total viable cells (μmol/L) in NT and GRAMD1B KO A2058 cells. Data are pooled from n = 3 independent experiments. Error bars, SD; Welch t test was used to assess statistical significance. *, P < 0.05. H, Total and free cholesterol levels normalized to total viable cells (μmol/L) in NT and GRAMD1B KO SKMEL5 cells. Data are pooled from n = 3 independent experiments. Error bars, SD; Welch t test was used to assess statistical significance. *, P < 0.05; ***, P < 0.001. I, Schematic of extraction of blood and tumor cholesterol from animals bearing NT or gramd1b KO tumors. Tumor cholesterol was extracted from primary tumor tissues in chloroform:isopropanol:NP40. See Methods for details. J, Total and free cholesterol levels normalized to tumor weight (mg) in NT or gramd1b KO tumors. Data are representative of n = 4 independent animals per group, measured in duplicates. Error bars, SD; Welch t test was used to assess statistical significance. *, P < 0.05. K, Total and free blood cholesterol levels in animals bearing NT or gramd1b KO tumors. Data are representative of n = 4 independent animals per group. Error bars, SD; Welch t test was used to assess statistical significance. *, P < 0.05. |