
Fig. 4
- ID
- ZDB-FIG-230613-144
- Publication
- Suresh et al., 2022 - Identifying the transcriptional drivers of metastasis embedded within localized melanoma
- Other Figures
- All Figure Page
- Back to All Figure Page
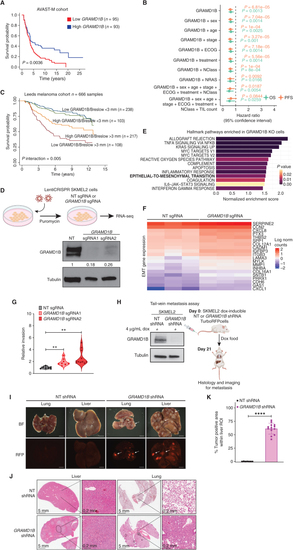
GRAMD1B is a metastasis suppressor in human melanoma. A, Kaplan–Meier survival plots comparing overall survival (OS) probabilities (Y-axis) as a function of time in years (x-axis) in patients with low (n = 95) and high (n = 93) GRAMD1B expression based on median GRAMD1B expression split in the AVAST-M melanoma cohort. A log-rank test comparing the survival distributions of both groups is indicated with a P value. B, Forest plot indicating the hazard ratio (HR) estimates related to GRAMD1B expression when predicting OS (green) and progression-free survival (PFS; orange) by means of Cox proportional hazard models controlling for different clinical variables (y-axis) in the AVAST-M melanoma cohort (n = 194). The HR estimates are indicated by the dots at the center of the error bars; the horizontal error bars correspond to the 95% confidence intervals of the HR. The two-sided Wald t test P values corresponding to GRAMD1B expression are indicated for each model and outcome. Sex (male or female), age (as a continuous variable), stage (IIB, IIC, IIIA, IIIB, or IIIC), ECOG; Eastern Cooperative Oncology Group Performance Status (0 or 1), treatment (bevacizumab or placebo), NClass (N0, N1, N2, or N3), NRAS mutation (mutant or wild-type); TIL count, tumor-infiltrating lymphocyte count (brisk, nonbrisk or absent). C, Kaplan–Meier plot for melanoma-specific survival in patients with low and high GRAMD1B expression (split on median) and Breslow thickness (split at 3 mm). There is a significant interaction (P = 0.005) between the two factors in Cox proportional hazards risk regression. The difference between the two bottom curves has an HR of 0.56 (95% CI, 0.38–0.83). D, Generation of SKMEL2 cells expressing nontargeting (NT) sgRNA and GRAMD1B sgRNA for bulk RNA-seq. RNA-seq was performed on n = 3 biological replicates per experimental group (top). Bottom, Western blot analysis of GRAMD1B in SKMEL2 cells expressing an NT sgRNA or 2 independent sgRNAs against GRAMD1B. Tubulin served as a loading control in this and all subsequent western blots. Quantification of GRAMD1B normalized to Tubulin and relative to NT sgRNA are in black text below the blot. E, Bar graph depicting top Hallmark pathways enriched in GRAMD1B KO cells plotted against the normalized enrichment score. An FDR cutoff of 0.1 was used for multiple hypothesis testing, and pathways are ranked by nominal P value.F, Heat map depicting differential upregulation of EMT genes in GRAMD1B KO cells. Log2 normalized counts of genes involved in the EMT pathway (FDR q = 0.028) are rescaled and plotted for NT and GRAMD1B sgRNA samples, n = 3 biological replicates per group. G, Quantification of invasiveness of GRAMD1B KO SKMEL2 cells relative to NT cells. Data represent fold change in invasion and pooled from n = 3 independent experiments. Invasiveness was calculated by normalizing Calcein fluorescence to the NT group. See Methods for details. Error bars, SD; two-tailed t test was used to assess statistical significance. **, P = 0.001 for GRAMD1B sgRNA1 vs. NT; **, P = 0.002 for GRAMD1B sgRNA2 vs. NT. H, Schematic for generation of dox-inducible shRNA cells for the tail-vein metastasis assay in mice. Left, western blot analysis of GRAMD1B in SKMEL2 cells expressing an NT shRNA or GRAMD1B shRNA and treated with dox for 4 days. Right, schematic of tail-vein metastasis assay using these shRNA cells. I, Brightfield and fluorescent (RFP) images of lung and liver tissues imaged at 6 × 3 weeks after tail-vein injection of NT or GRAMD1B shRNA SKMEL2 cells. White arrows represent metastatic tumor cells. BF, Brightfield. J, Histology of mouse lung and liver tissues from mice injected with NT or GRAMD1B shRNA SKMEL2 cells. Scale bars, 5 mm or 0.2 mm. K, Quantification of metastatic burden in livers of mice injected with NT or GRAMD1B shRNA SKMEL2 cells, represented as % tumor-positive liver area. n = 2 animals per group, with 4–5 regions of interest (ROI) per liver lobe. Error bars, SD; Welch t test was used to assess statistical significance. ****, P < 0.00001. |