
|
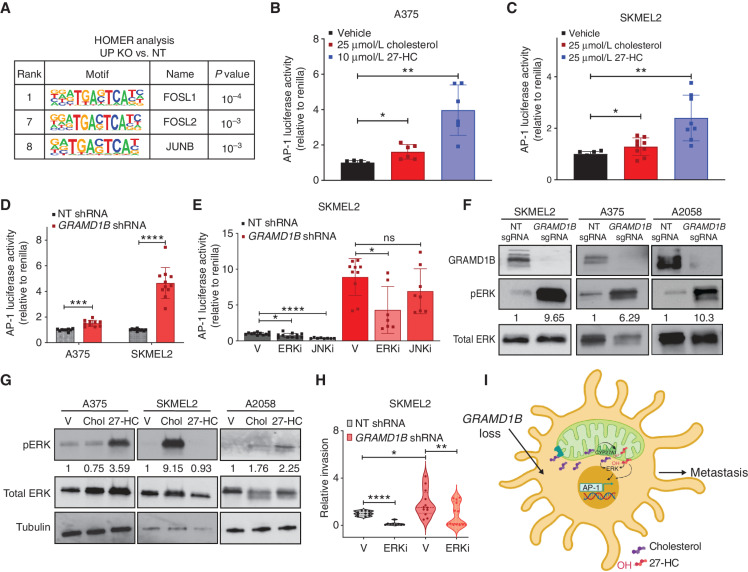
Fig. 7
Sterol overload activates AP-1 via ERK signaling to mediate invasion upon GRAMD1B loss in melanoma. A, HOMER analysis of top motifs enriched in genes upregulated in GRAMD1B KO cells. Motifs related to the AP-1 complex are highlighted in the table along with rank and P value. Dual reporter analysis of AP-1 luciferase reporter activity in A375 cells treated with 25 μmol/L cholesterol or 10 μmol/L 27-HC for 48 hours. Firefly AP-1 luciferase activity was normalized to Renilla luciferase and relative luciferase activity is plot normalized to vehicle. Data are pooled from n = 3 independent experiments. Error bars, SD; Welch t test was performed to assess statistical significance. *, P = 0.01; **, P = 0.001. C, Dual reporter analysis of AP-1 luciferase reporter activity in SKMEL2 cells treated with 25 μmol/L cholesterol or 25 μmol/L 27-HC for 48 hours. Firefly AP-1 luciferase activity was normalized to Renilla luciferase and relative luciferase activity is plot normalized to vehicle. Data are pooled from n = 3 independent experiments. Error bars, SD; Welch t test was performed to assess statistical significance. *, P = 0.04,**, P = 0.002. D, Dual reporter analysis of AP-1 luciferase reporter activity in A375 and SKMEL2 nontargeting (NT) or GRAMD1B knockdown cells. Firefly AP-1 luciferase activity was normalized to Renilla luciferase and relative luciferase activity is plot normalized to NT shRNA. Data are pooled from n = 3 independent experiments. Error bars, SD, a Welch t test was performed to assess statistical significance. ***, P = 0.0003; ****, P = 0.000038. E, Dual reporter analysis of AP-1 luciferase reporter activity in SKMEL2 NT or GRAMD1B knockdown cells treated with DMSO (vehicle), 200 nmol/L JNKi or 200 nmol/L ERKi for 48 hours. Firefly AP-1 luciferase activity was normalized to Renilla luciferase and relative luciferase activity is plot normalized to NT shRNA (vehicle). Data are pooled from n = 3 independent experiments. Error bars, SD; Welch t test was performed to assess statistical significance. *, P = 0.01; ****, P < 0.000001. V, vehicle. F, Western blots depicting phosphorylation of ERK1/2 in SKMEL2, A375, and A2058 cells expressing NT or GRAMD1B sgRNAs. Data are representative of n = 2–3 independent experiments. Quantification of phosphorylated ERK protein levels relative to total ERK in black text below the blot. G, Western blots depicting phosphorylation of ERK1/2 in A375, SKMEL2, and A2058 cells stimulated with cholesterol or 27-HC for 48 hours. Data are representative of n = 2 independent experiments. Quantification of phosphorylated ERK protein levels relative to total ERK in black text below the blot. H, Quantification of relative invasion in SKMEL2 cells expressing NT or GRAMD1B shRNA treated with 100 nmol/L ERKi for 24 hours. The number of Hoechst+ cells in the bottom chamber in each group was normalized to the NT group to obtain relative invasion. See Methods for details. Data are pooled from n = 3 independent experiments. Error bars, SD; Welch t test was performed. *, P < 0.05; **, P < 0.01; ****, P < 0.0001. I, Working model of prometastatic functions of GRAMD1B loss in melanoma. GRAMD1B loss results in free cholesterol, some of which may move into the mitochondria, where it is converted to 27-HC. Free sterols induce ERK signaling to activate the AP-1 complex and mediate an invasion transcriptional program in melanoma to promote metastasis.