
|
Fig. 3
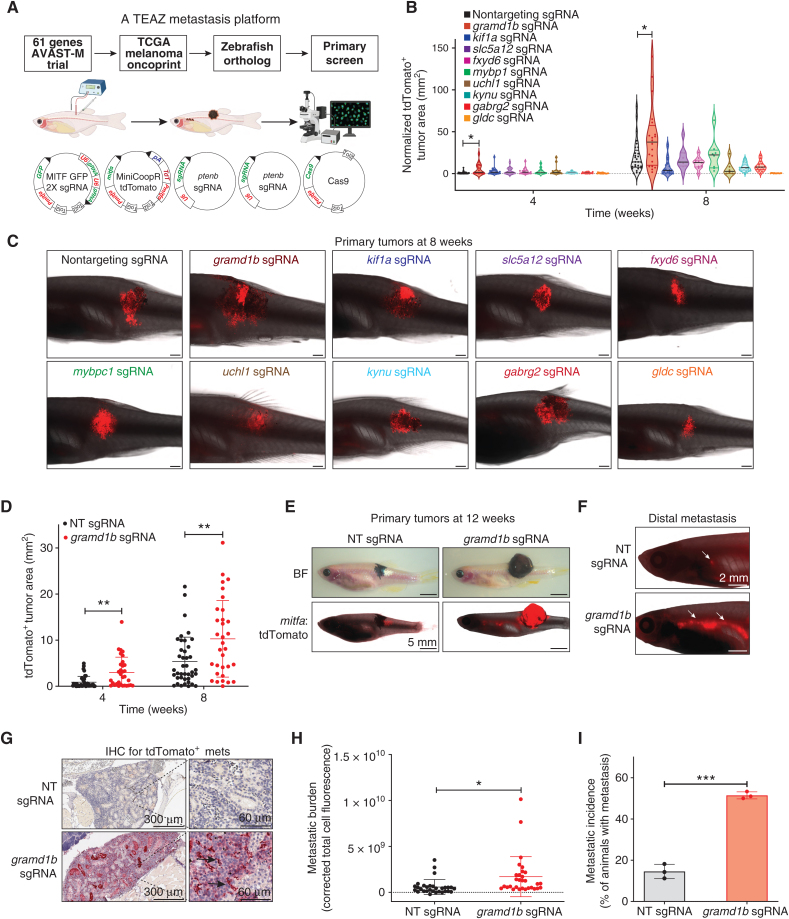
An in vivo screen identifies GRAMD1B as a metastasis suppressor in melanoma. A, Strategy for in vivo metastasis screen. Zebrafish orthologs for candidate genes were obtained and MITF GFP 2X sgRNA pools expressing 4 sgRNAs per candidate were co-electroporated with the multiplasmid mix to induce metastatic melanoma. Candidates from the primary screen were assessed for their ability to modulate metastasis via fluorescent imaging of areas separate from the primary tumor. See Methods for details. B, Quantification of tdTomato+ primary tumor area in animals expressing nontargeting (NT) sgRNA or sgRNA pools against candidates at 4 and 8 weeks after TEAZ. Data were obtained from n = 3 independent experiments, and all data points were normalized to NT sgRNA tumors at week 4. Error bars, SD; Mann–Whitney test was used to compare ranks between tumor area of candidates vs. NT sgRNA at each time point. *, P = 0.013. C, Representative images showing tdTomato+ melanomas from animals expressing a NT sgRNA or candidate sgRNAs at 8 weeks after TEAZ. Scale bar, 1 mm.D, Quantification of tdTomato+ primary tumor area in a validation cohort of animals expressing NT sgRNA or gramd1b sgRNAs at 4 and 8 weeks after TEAZ. Data are pooled from n = 4 independent experiments. Error bars, SD; Mann–Whitney test was used to compare ranks between tumor areas of gramd1b sgRNA vs. NT sgRNA at each time point to obtain; **, P = 0.001 at 4 weeks; **, P = 0.007 at 8 weeks. E, Representative brightfield and fluorescent images for tdTomato showing animals bearing tumors expressing NT sgRNA or gramd1b sgRNAs at 12 weeks after TEAZ. Scale bar, 5 mm. BF, Brightfield. F, Representative fluorescent image of tdTomato+ distal metastasis (white arrows indicate metastatic cells) in the kidney marrow of animals expressing NT or gramd1b sgRNAs. Scale bar, 2 mm. G, IHC validation of tdTomato+ metastatic tumor cells (black arrows) in kidney marrow of an animal expressing gramd1b sgRNAs. Scale bars indicated on image. mets, metastases. H, Quantification of metastatic burden in animals expressing NT or gramd1b sgRNAs represented as corrected total cell fluorescence (integrated density, sum of values of tdTomato pixels in image) at 12 weeks after TEAZ. Data are pooled from n = 4 independent experiments. Error bars, SD; Welch t test was used to test statistical significance. *, P = 0.0122. I, Quantification of metastatic incidence in animals with NT or gramd1b KO melanomas expressed as % of fish with metastasis at 12 weeks after TEAZ. Data are pooled from n = 4 independent experiments. Error bars, SD; Welch t test was used to assess statistical significance. ***, P = 0.0005.