
|
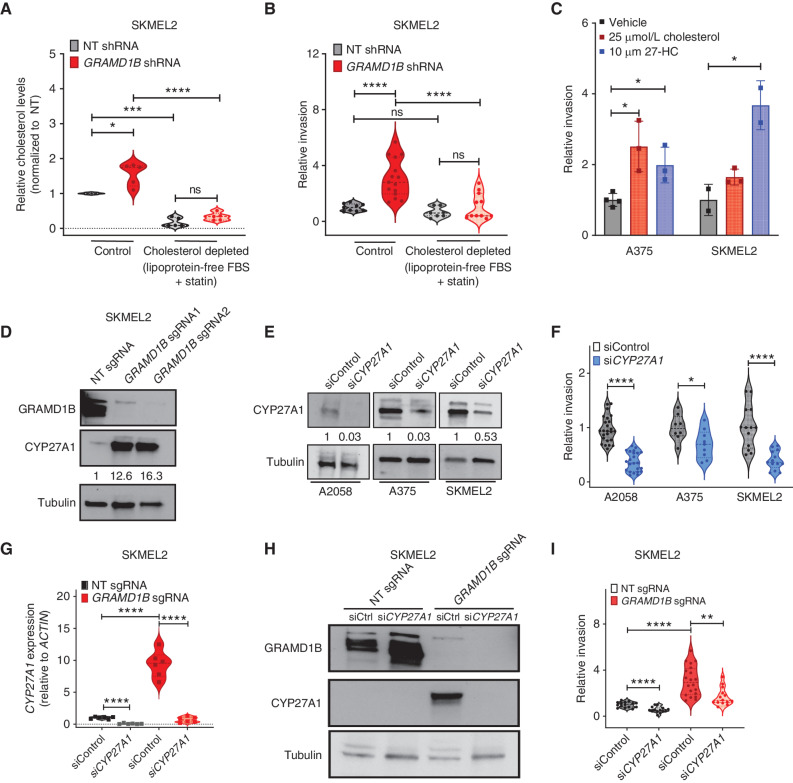
Fig. 6
Free cholesterol and 27-hydroxycholesterol promote tumor invasion under GRAMD1B loss. A, Quantification of relative cholesterol levels (represented as fold change and normalized to NT cells) in SKMEL2 NT and GRAMD1B shRNA cells cultured in control media or cholesterol-depleted media. To deplete cholesterol, cells were grown in media containing 10% lipoprotein-free FBS and Simvastatin for 48 hours. See Methods for details. Data are pooled from n = 3 independent experiments; error bars, SD; Welch t test was used to assess statistical significance. *, P = 0.018; ***, P = 0.0005; ****, P < 0.0001. B, Quantification of relative invasion in cells from A. The number of fluorescent cells in the bottom chamber was quantified and normalized to the NT group to obtain relative invasion. Data are pooled from n = 3 independent experiments; error bars, SD; Welch t test was used to assess statistical significance. ***, P = 0.0001; ****, P < 0.0001. C, Quantification of relative invasion (represented as fold change and normalized to vehicle) in A375 and SKMEL2 cells treated with cholesterol (25 μmol/L) or 27-hydroxycholesterol (27-HC, 10 μmol/L) for 48 hours. The number of fluorescent cells in the bottom chamber was quantified and normalized to the vehicle group to obtain relative invasion. Data are pooled from n = 3 independent experiments; error bars, SD; Welch t test was used to assess statistical significance. *, P < 0.05. D, Western blot analysis of CYP27A1 and GRAMD1B in SKMEL2 NT and GRAMD1B KO cells. CYP27A1 levels normalized to Tubulin are in black text below the blot. E, Western blot analysis of CYP27A1 in A2058, A375, and SKMEL2 cells transfected with control siRNA or CYP27A1 siRNA. CYP27A1 levels normalized to Tubulin are in black text below the blot. F, Relative invasion of A2058, A375, and SKMEL2 cells transfected with control siRNA or CYP27A1 siRNA. The number of fluorescent cells in the bottom chamber was quantified and normalized to control cells to obtain relative invasion. Data are pooled from n = 3 independent experiments; error bars, SD; Welch t test was used to assess statistical significance. *, P < 0.05; ****, P < 0.0001. G, Real-time PCR analysis of CYP27A1 in SKMEL2 NT and GRAMD1B KO cells transfected with control siRNA or CYP27A1 siRNA. Data are pooled from n = 3 independent experiments; error bars, SD; Welch t test was used to assess statistical significance. ****, P < 0.0001. H, Western blot analysis of CYP27A1 and GRAMD1B in SKMEL2 nontargeting (NT) and GRAMD1B KO cells transfected with control siRNA or CYP27A1 siRNA. I, Relative invasion of SKMEL2 NT and GRAMD1B KO cells transfected with control siRNA or CYP27A1 siRNA. Data are pooled from n = 3 independent experiments; error bars, SD; Welch t test was used to assess statistical significance. ****, P < 0.0001; **, P < 0.01.