FIGURE SUMMARY
Title

ERBB and P-glycoprotein inhibitors break resistance in relapsed neuroblastoma models through P-glycoprotein

Authors
Rösch, L., Herter, S., Najafi, S., Ridinger, J., Peterziel, H., Cinatl, J., Jones, D.T.W., Michaelis, M., Witt, O., Oehme, I.
Source
Full text @ Mol. Oncol.

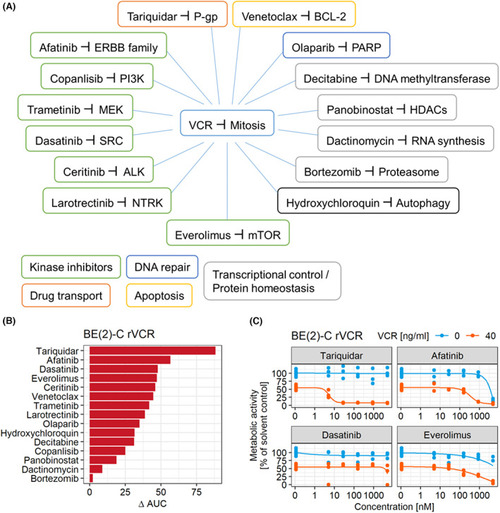
Functional screen identifies ERBB4 and P‐gp inhibitors to break resistance. (A) Schematic representation of the drugs and their targets. Drug classes are indicated. (B) A metabolic activity screen read‐out (CellTiterGlo) of combination treatment of VCR with 15 anticancer drugs (14 clinically approved) was performed with BE(2)‐C rVCR. The cells were treated with 0, 5, 28, 158, 889, and 5000 nm of the 15 drugs alone or in combination with 40 ng·mL−1 VCR for 48 h. The difference in area under the curve (AUC) between single and combination treatment (ΔAUC) was calculated. The screen was performed in triplicates. (C) Concentration curves of the top four AUC hits (in triplicates) from (B) with (orange) or without (blue) addition of 40 ng·mL−1 VCR.

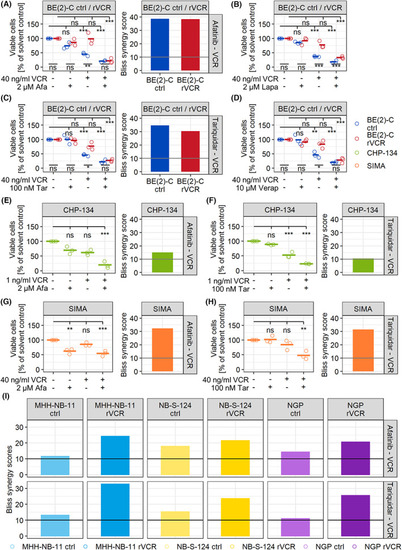
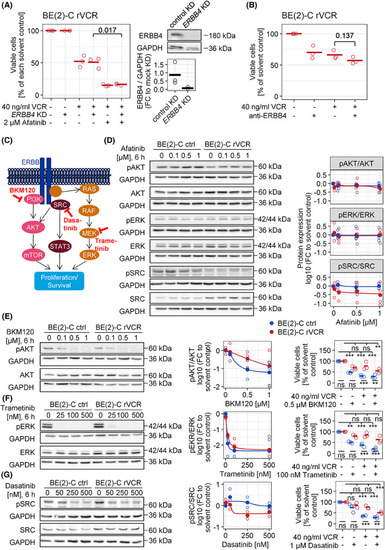
Inhibitors of the ERBB family and P‐gp break resistance in BE(2)‐C rVCR. (A–D) BE(2)‐C control and rVCR cells were treated with 40 ng·mL−1 VCR and the indicated concentrations of the ERBB inhibitors afatinib (A) and lapatinib (B) or the P‐gp inhibitors tariquidar (C) or verapamil (D) for 48 h. (E, F) CHP‐134 cells were treated with 1 ng·mL−1 VCR and 2 μm afatinib (E) or 100 nm tariquidar (F) for 48 h. (G, H) SIMA cells were treated with 40 ng·mL−1 VCR and 2 μm afatinib (G) or 100 nm tariquidar (H) for 48 h. (A–H) The number of viable cells was determined by trypan blue exclusion. The percent of viable cells relative to the solvent control of each cell line was calculated. Presented are biological replicates (n = 3) and their means. Statistics were calculated with ANOVA followed by Tukey's post‐test. Shown are the statistics for the comparisons between the cell lines (bottom) as well as the comparisons to solvent control for each cell line (top). (A–I) Bliss synergy scores for the indicated cell lines were calculated from metabolic activity data (0, 10, 20, 40, 100 ng·mL−1 VCR ±0, 0.5, 1, 2 μm afatinib or 0, 1, 10, 1000 nm tariquidar for 48 h in all cell lines) using synergyfinder. A score > 10 (marked with a line) indicates synergy. ***P < 0.001, **P < 0.01, *P < 0.05, ns, not significant.

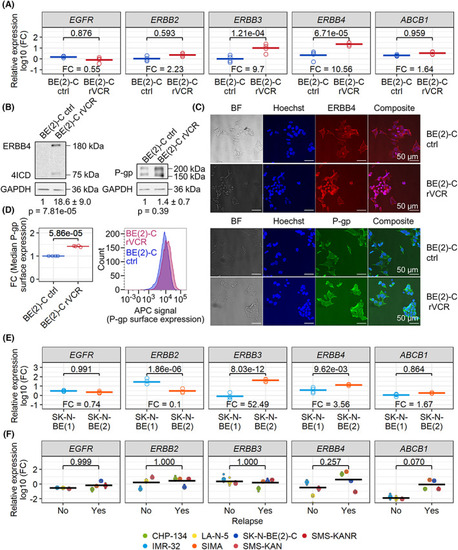
ERBB3, ERBB4, and P‐gp/ABCB1 are upregulated in resistant BE(2)‐C and SK‐N‐BE(2). (A) Real‐time PCR of the indicated genes was performed on cDNA of untreated control BE(2)‐C and BE(2)‐C rVCR. Expression is normalized to a mix of five neuroblastoma cell lines. P values are indicated and were calculated with ANOVA followed by Tukey's post‐test. The fold change between control and resistant BE(2)‐C is likewise indicated. Biological replicates (n = 4) and their means are shown. (B) Western blotting against ERBB4 and P‐gp was performed with untreated control BE(2)‐C and BE(2)‐C rVCR. Depicted are representative blots of at least four biological replicates. Quantifications were normalized first to the respective GAPDH and then to control BE(2)‐C. Noted are the means of the replicates and their standard deviations. Significance was calculated by Student's t test against 0 of the log10 transformed fold change values of BE(2)‐C rVCR. (C) Representative immunofluorescence images of untreated control BE(2)‐C and BE(2)‐C rVCR (12 technical replicates each). Cells were labeled with ERBB4 or P‐gp primary antibody and stained with Alexa Fluor 508 (ERBB4)‐ or Alexa Fluor 488 (P‐gp)‐labeled secondary antibodies, as well as the DNA intercalating dye Hoechst 33342. The white scale bar indicates 50 μm. (D) BE(2)‐C ctrl and rVCR were immunostained with P‐gp primary antibody and APC‐labeled secondary antibody, and surface P‐gp was analyzed with flow cytometry. The right panel shows a representative signal distribution of n = 4 independent replicates. The median APC signal normalized to control BE(2)‐C is depicted in the left panel. The four replicates and their means are shown. Significance was calculated by Student's t test against 0 of the log10 transformed fold change values of BE(2)‐C rVCR. (E) Real‐time PCR of the indicated genes was performed on untreated SK‐N‐BE(1) and SK‐N‐BE(2) cells. Expression is normalized to a mix of five neuroblastoma cell lines. P values are indicated and were calculated by ANOVA followed by Tukey's post‐test. The fold change between SK‐N‐BE(1) and SK‐N‐BE(2) is likewise indicated. Biological replicates (n = 4) and their means are shown. (F) Real‐time PCR of the indicated genes was performed on a panel of three non‐relapsed and four relapsed neuroblastoma cell lines. Expression is normalized to a mix of five neuroblastoma cell lines. The biological replicates of each cell line (n ≥ 3), the mean relative expression of each cell line, and the group means are shown. P values between group means are indicated and were calculated by ANOVA followed by Tukey's post‐test.

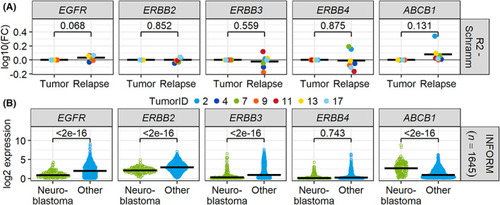
ABCB1 is upregulated in neuroblastoma relapsed tumors. (A) Gene expression data of 18 tumor samples from the dataset by Schramm et al. (GSE65303) were downloaded from R2 (http://r2.amc.nl, 09 September 2021). Only paired samples with data at primary diagnosis (tumor) and at relapse were included (n = 7 pairs). Statistics of log‐transformed relapse values were calculated with Student's t test against 0. (B) Gene expression data from the INFORM registry (n = 1645). Comparison of neuroblastoma cases (n = 162) vs. all other entities. Statistics were calculated by ANOVA followed by Tukey's post‐test including all genes of the ERBB and ABC families present in the respective datasets.

Afatinib breaks VCR resistance independent of ERBB4. (A) ERBB4 knockdown and control transfection were performed on BE(2)‐C rVCR cells, which were treated 24 h later with 40 ng·mL−1 VCR and/or 2 μm afatinib for 48 h. Dead cells were stained with trypan blue, and only viable cells were counted. The percent of viable cells relative to the solvent control of each knockdown was calculated. Presented are biological replicates (n = 3) and their mean. Statistics were calculated with Student's t test. Knockdown efficiency was validated by western blot. Quantifications were normalized to GAPDH and negative control transfection. (B) BE(2)‐C rVCR cells were treated with 1 μg·mL−1 anti‐ERBB4 blocking antibody and/or 40 ng·mL−1 VCR for 48 h. Dead cells were stained with trypan blue, and only viable cells were counted. The percent of viable cells relative to the solvent control was calculated. Presented are biological replicates (n = 3) and their mean. Statistics were calculated with Student's t test. (C) Schematic of ERBB4 downstream pathways leading to cell survival and proliferation. (D) Control BE(2)‐C and BE(2)‐C rVCR were treated with 0, 0.1, 0.5, and 1 μm afatinib for 6 h. Phosphorylation of AKT, ERK, and SRC, as well as total protein levels, were assessed by western blot. Representative blots of four biological replicates are shown. Quantified phosphoprotein expression was normalized first to the respective GAPDH, then to GAPDH normalized complete protein, and finally to solvent control of control BE(2)‐C (right panel). The same GAPDH control applies for AKT/pERK and pAKT/ERK/SRC, respectively. (E–G) Control BE(2)‐C and BE(2)‐C rVCR were treated with the indicated concentrations BKM120, trametinib or dasatinib for 6 h (western blot) or 48 h in combination with 40 ng·mL−1 VCR (viability assay, right most panels). The phosphorylation and complete protein levels of AKT, ERK, and SRC were assessed by western blotting. Representative blots of three biological replicates are shown. Phosphoprotein expression was normalized first to the respective GAPDH, then to GAPDH normalized complete protein and finally to the solvent control of control BE(2)‐C. Quantifications are shown in the middle panels. Viability was assessed by trypan blue exclusion. The percent of viable cells relative to the solvent control of each cell line was calculated. Presented are biological replicates (n = 3) and their mean. Statistics were calculated with ANOVA followed by Tukey's post‐test. Shown are the comparisons between the cell lines (bottom) as well as the comparisons to solvent control for each cell line (top). ***P < 0.001, **P < 0.01, ns, not significant.

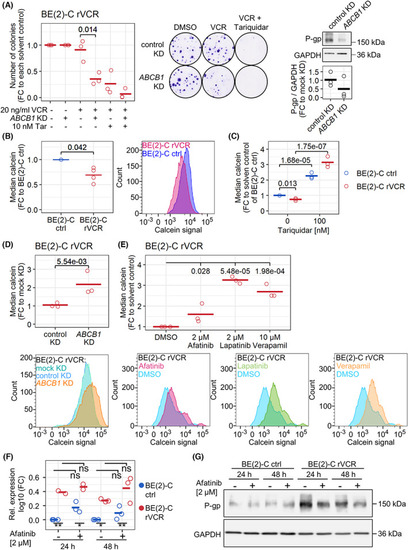
P‐gp mediates resistance in BE(2)‐C rVCR. (A) a colony assay was performed after ABCB1 knockdown or negative control transfection. Knockdown was induced for 24 h with subsequent treatment with 20 ng·mL−1 VCR and/or 10 nm tariquidar for 72 h. After medium change, colonies were left to grow for 9 days. Representative example images of three biological replicates are shown. Quantification is depicted as the colony number normalized to the solvent control of each knockdown. Three biological replicates and their means are shown. Statistics of log‐transformed values were calculated with Student's t test. The knockdown efficiency was validated by western blotting. Quantifications were normalized to GAPDH and negative control transfection. (B) Untreated control BE(2)‐C and BE(2)‐C rVCR were stained with 10 nm calcein for 15 min and analyzed by flow cytometry. The right panel depicts a representative calcein signal distribution of four biological replicates. The median calcein signal, normalized to control BE(2)‐C, is depicted on the left. Statistics of log‐transformed BE(2)‐C rVCR values were calculated with Student's t test against 0. (C) Control BE(2)‐C and BE(2)‐C rVCR were treated with 100 nm tariquidar for 24 h and stained with 10 nm calcein for 15 min. Intracellular calcein was analyzed by flow cytometry. Median calcein normalized to the solvent control of BE(2)‐C ctrl is shown. Depicted are biological replicates (n = 3) and their mean. Statistics were computed by ANOVA of the log‐transformed values followed by Tukey's post‐test. (D) ABCB1 knockdown and negative control transfection were performed in BE(2)‐C rVCR for a total of 48 h, followed by staining with 100 nm calcein for 30 min. Intracellular calcein was assessed by flow cytometry. The lower panel shows a representative calcein signal distribution of three biological replicates. The upper panel depicts the median calcein signal normalized to negative control transfection. Three biological replicates and their means are shown. Statistics were calculated on log‐transformed values with Student's t‐test. (E) BE(2)‐C rVCR cells were treated with the indicated concentrations of afatinib, lapatinib, or verapamil for 24 h and stained with 10 nm calcein for 15 min. Intracellular calcein was analyzed by flow cytometry. Median calcein was normalized to solvent control. Depicted are biological replicates (n = 3) and their mean. Representative calcein signal distributions are depicted in the lower panels. Statistics were computed by ANOVA of the log‐transformed values followed by Tukey's post‐test. (F, G) BE(2)‐C ctrl and rVCR were treated for 24 and 48 h with 2 μm afatinib. ABCB1 mRNA (F) and P‐gp protein (G) levels were evaluated by RT–PCR and western blotting, respectively. GAPDH served as a loading control. Statistics were calculated with ANOVA followed by Tukey's post‐test. Shown are the statistics for the comparisons between the cell lines (bottom) as well as the comparisons to solvent control for each cell line (top).

Combination of VCR with afatinib or tariquidar induces apoptosis and reduces tumor volume in vivo. (A–D) Control BE(2)‐C and BE(2)‐C rVCR were treated with 40 ng·mL−1 VCR, 2 μm afatinib, 100 nm tariquidar, or their combination for 48 h. all statistics were calculated with ANOVA of log‐transformed values followed by Tukey's post‐test. Shown are the statistics for the comparisons between the cell lines (bottom) as well as the comparisons to the solvent control for each cell line (top). (A, B) Western blot against PARP, BID, and transferrin receptor (TfR). Representative blots of three biological replicates are shown. Quantifications on the right depict biological replicates (n = 3) and their means. Fold changes depicted are cleaved PARP (cl‐PARP) over full‐length PARP (fl‐PARP), BID over GAPDH, and TfR over GAPDH, all normalized to the solvent control of each cell line. (C) Caspase‐3/7 activity was determined by cleavage of fluorescently labeled DEVD peptide in protein lysates. Depicted are biological replicates (n = 3) and their means, normalized to the solvent control of control BE(2)‐C. (D) Lipid peroxidation was evaluated by staining with 20 μm BODIPY 581/591 for 30 min followed by flow cytometric analysis of oxidized BODIPY. Depicted are biological replicates (n = 3) and their means normalized to the solvent control of control BE(2)‐C. (E) Change in tumor volume from day one post‐injection to day three post‐injection in zebrafish embryo xenografts with BE(2)‐C rVCR. Zebrafish embryos were treated with the indicated concentrations of VCR and tariquidar for 48 h. Each circle reflects one individual xenografts (solvent control n = 29; VCR n = 14; tariquidar n = 13, combo n = 19); means are presented by the black line. Statistics were calculated with Student's t test. ***P < 0.001, **P < 0.01, *P < 0.05, ns, not significant.

Acknowledgments
This image is the copyrighted work of the attributed author or publisher, and ZFIN has permission only to display this image to its users. Additional permissions should be obtained from the applicable author or publisher of the image. Full text @ Mol. Oncol.