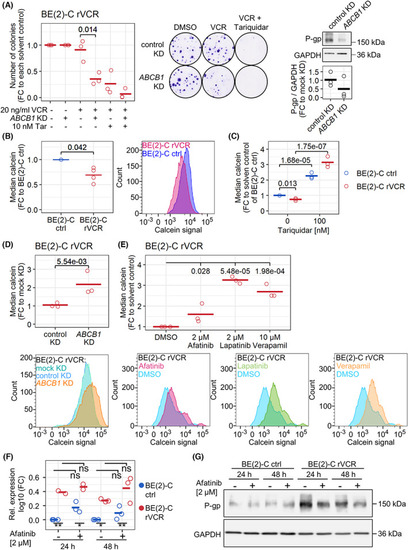
P‐gp mediates resistance in BE(2)‐C rVCR. (A) a colony assay was performed after ABCB1 knockdown or negative control transfection. Knockdown was induced for 24 h with subsequent treatment with 20 ng·mL−1 VCR and/or 10 nm tariquidar for 72 h. After medium change, colonies were left to grow for 9 days. Representative example images of three biological replicates are shown. Quantification is depicted as the colony number normalized to the solvent control of each knockdown. Three biological replicates and their means are shown. Statistics of log‐transformed values were calculated with Student's t test. The knockdown efficiency was validated by western blotting. Quantifications were normalized to GAPDH and negative control transfection. (B) Untreated control BE(2)‐C and BE(2)‐C rVCR were stained with 10 nm calcein for 15 min and analyzed by flow cytometry. The right panel depicts a representative calcein signal distribution of four biological replicates. The median calcein signal, normalized to control BE(2)‐C, is depicted on the left. Statistics of log‐transformed BE(2)‐C rVCR values were calculated with Student's t test against 0. (C) Control BE(2)‐C and BE(2)‐C rVCR were treated with 100 nm tariquidar for 24 h and stained with 10 nm calcein for 15 min. Intracellular calcein was analyzed by flow cytometry. Median calcein normalized to the solvent control of BE(2)‐C ctrl is shown. Depicted are biological replicates (n = 3) and their mean. Statistics were computed by ANOVA of the log‐transformed values followed by Tukey's post‐test. (D) ABCB1 knockdown and negative control transfection were performed in BE(2)‐C rVCR for a total of 48 h, followed by staining with 100 nm calcein for 30 min. Intracellular calcein was assessed by flow cytometry. The lower panel shows a representative calcein signal distribution of three biological replicates. The upper panel depicts the median calcein signal normalized to negative control transfection. Three biological replicates and their means are shown. Statistics were calculated on log‐transformed values with Student's t‐test. (E) BE(2)‐C rVCR cells were treated with the indicated concentrations of afatinib, lapatinib, or verapamil for 24 h and stained with 10 nm calcein for 15 min. Intracellular calcein was analyzed by flow cytometry. Median calcein was normalized to solvent control. Depicted are biological replicates (n = 3) and their mean. Representative calcein signal distributions are depicted in the lower panels. Statistics were computed by ANOVA of the log‐transformed values followed by Tukey's post‐test. (F, G) BE(2)‐C ctrl and rVCR were treated for 24 and 48 h with 2 μm afatinib. ABCB1 mRNA (F) and P‐gp protein (G) levels were evaluated by RT–PCR and western blotting, respectively. GAPDH served as a loading control. Statistics were calculated with ANOVA followed by Tukey's post‐test. Shown are the statistics for the comparisons between the cell lines (bottom) as well as the comparisons to solvent control for each cell line (top).
|
