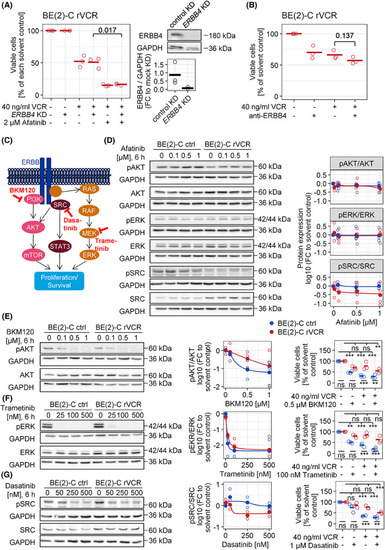
Afatinib breaks VCR resistance independent of ERBB4. (A) ERBB4 knockdown and control transfection were performed on BE(2)‐C rVCR cells, which were treated 24 h later with 40 ng·mL−1 VCR and/or 2 μm afatinib for 48 h. Dead cells were stained with trypan blue, and only viable cells were counted. The percent of viable cells relative to the solvent control of each knockdown was calculated. Presented are biological replicates (n = 3) and their mean. Statistics were calculated with Student's t test. Knockdown efficiency was validated by western blot. Quantifications were normalized to GAPDH and negative control transfection. (B) BE(2)‐C rVCR cells were treated with 1 μg·mL−1 anti‐ERBB4 blocking antibody and/or 40 ng·mL−1 VCR for 48 h. Dead cells were stained with trypan blue, and only viable cells were counted. The percent of viable cells relative to the solvent control was calculated. Presented are biological replicates (n = 3) and their mean. Statistics were calculated with Student's t test. (C) Schematic of ERBB4 downstream pathways leading to cell survival and proliferation. (D) Control BE(2)‐C and BE(2)‐C rVCR were treated with 0, 0.1, 0.5, and 1 μm afatinib for 6 h. Phosphorylation of AKT, ERK, and SRC, as well as total protein levels, were assessed by western blot. Representative blots of four biological replicates are shown. Quantified phosphoprotein expression was normalized first to the respective GAPDH, then to GAPDH normalized complete protein, and finally to solvent control of control BE(2)‐C (right panel). The same GAPDH control applies for AKT/pERK and pAKT/ERK/SRC, respectively. (E–G) Control BE(2)‐C and BE(2)‐C rVCR were treated with the indicated concentrations BKM120, trametinib or dasatinib for 6 h (western blot) or 48 h in combination with 40 ng·mL−1 VCR (viability assay, right most panels). The phosphorylation and complete protein levels of AKT, ERK, and SRC were assessed by western blotting. Representative blots of three biological replicates are shown. Phosphoprotein expression was normalized first to the respective GAPDH, then to GAPDH normalized complete protein and finally to the solvent control of control BE(2)‐C. Quantifications are shown in the middle panels. Viability was assessed by trypan blue exclusion. The percent of viable cells relative to the solvent control of each cell line was calculated. Presented are biological replicates (n = 3) and their mean. Statistics were calculated with ANOVA followed by Tukey's post‐test. Shown are the comparisons between the cell lines (bottom) as well as the comparisons to solvent control for each cell line (top). ***P < 0.001, **P < 0.01, ns, not significant.
|
