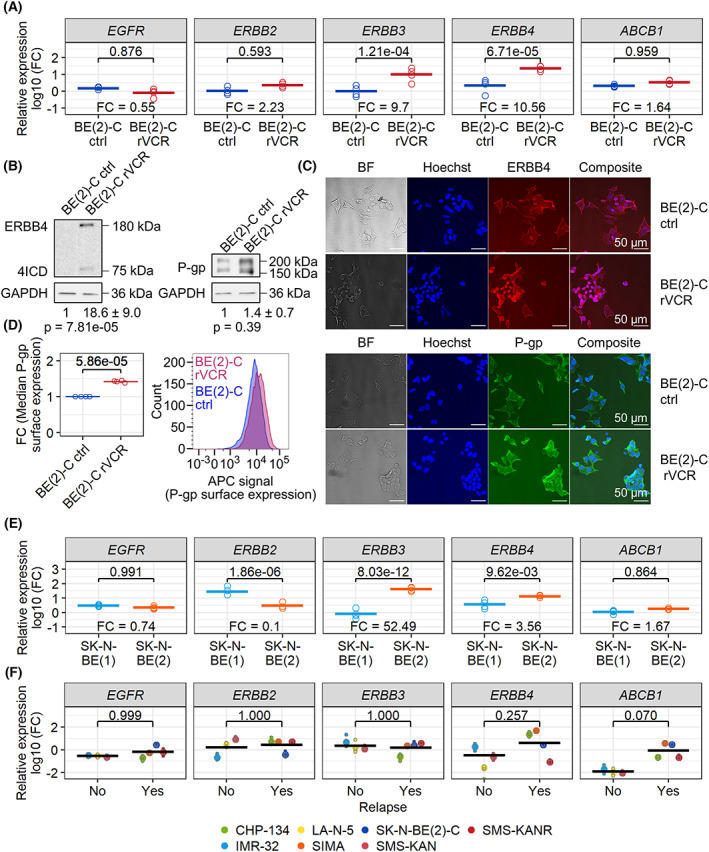
IMAGE

Fig. 3

ID
ZDB-IMAGE-230107-9
Source
Figures for Rösch et al., 2022
Image
Figure Caption

Fig. 3

ERBB3, ERBB4, and P‐gp/ABCB1 are upregulated in resistant BE(2)‐C and SK‐N‐BE(2). (A) Real‐time PCR of the indicated genes was performed on cDNA of untreated control BE(2)‐C and BE(2)‐C rVCR. Expression is normalized to a mix of five neuroblastoma cell lines. P values are indicated and were calculated with ANOVA followed by Tukey's post‐test. The fold change between control and resistant BE(2)‐C is likewise indicated. Biological replicates (n = 4) and their means are shown. (B) Western blotting against ERBB4 and P‐gp was performed with untreated control BE(2)‐C and BE(2)‐C rVCR. Depicted are representative blots of at least four biological replicates. Quantifications were normalized first to the respective GAPDH and then to control BE(2)‐C. Noted are the means of the replicates and their standard deviations. Significance was calculated by Student's t test against 0 of the log10 transformed fold change values of BE(2)‐C rVCR. (C) Representative immunofluorescence images of untreated control BE(2)‐C and BE(2)‐C rVCR (12 technical replicates each). Cells were labeled with ERBB4 or P‐gp primary antibody and stained with Alexa Fluor 508 (ERBB4)‐ or Alexa Fluor 488 (P‐gp)‐labeled secondary antibodies, as well as the DNA intercalating dye Hoechst 33342. The white scale bar indicates 50 μm. (D) BE(2)‐C ctrl and rVCR were immunostained with P‐gp primary antibody and APC‐labeled secondary antibody, and surface P‐gp was analyzed with flow cytometry. The right panel shows a representative signal distribution of n = 4 independent replicates. The median APC signal normalized to control BE(2)‐C is depicted in the left panel. The four replicates and their means are shown. Significance was calculated by Student's t test against 0 of the log10 transformed fold change values of BE(2)‐C rVCR. (E) Real‐time PCR of the indicated genes was performed on untreated SK‐N‐BE(1) and SK‐N‐BE(2) cells. Expression is normalized to a mix of five neuroblastoma cell lines. P values are indicated and were calculated by ANOVA followed by Tukey's post‐test. The fold change between SK‐N‐BE(1) and SK‐N‐BE(2) is likewise indicated. Biological replicates (n = 4) and their means are shown. (F) Real‐time PCR of the indicated genes was performed on a panel of three non‐relapsed and four relapsed neuroblastoma cell lines. Expression is normalized to a mix of five neuroblastoma cell lines. The biological replicates of each cell line (n ≥ 3), the mean relative expression of each cell line, and the group means are shown. P values between group means are indicated and were calculated by ANOVA followed by Tukey's post‐test.

Acknowledgments
This image is the copyrighted work of the attributed author or publisher, and ZFIN has permission only to display this image to its users. Additional permissions should be obtained from the applicable author or publisher of the image. Full text @ Mol. Oncol.