IMAGE

Fig. 2

ID
ZDB-IMAGE-230107-8
Source
Figures for Rösch et al., 2022
Image
Figure Caption

Fig. 2

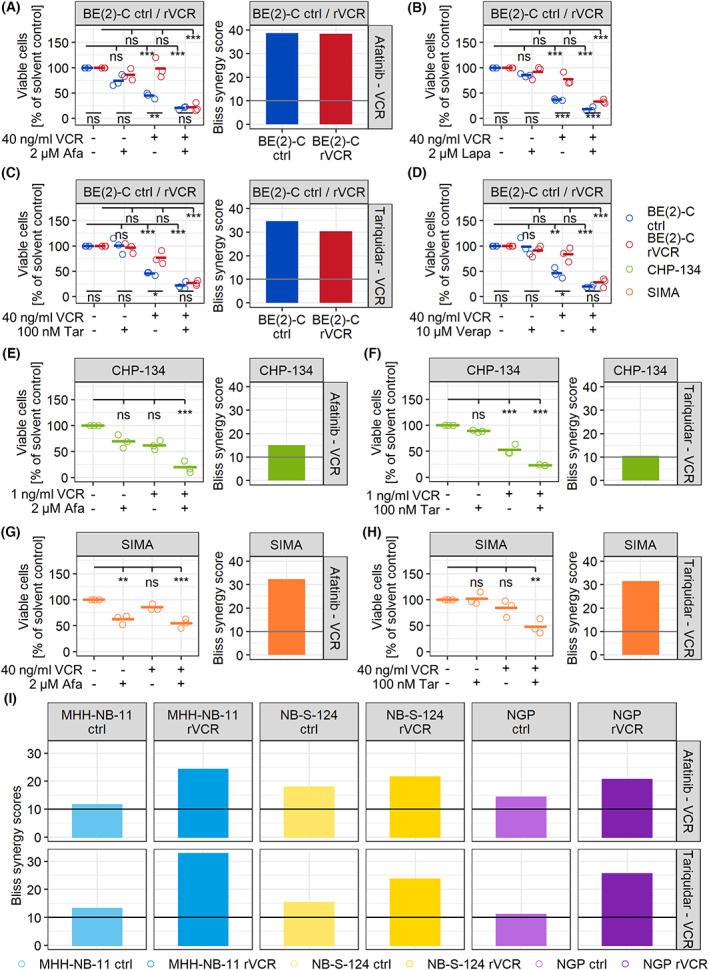
Inhibitors of the ERBB family and P‐gp break resistance in BE(2)‐C rVCR. (A–D) BE(2)‐C control and rVCR cells were treated with 40 ng·mL−1 VCR and the indicated concentrations of the ERBB inhibitors afatinib (A) and lapatinib (B) or the P‐gp inhibitors tariquidar (C) or verapamil (D) for 48 h. (E, F) CHP‐134 cells were treated with 1 ng·mL−1 VCR and 2 μm afatinib (E) or 100 nm tariquidar (F) for 48 h. (G, H) SIMA cells were treated with 40 ng·mL−1 VCR and 2 μm afatinib (G) or 100 nm tariquidar (H) for 48 h. (A–H) The number of viable cells was determined by trypan blue exclusion. The percent of viable cells relative to the solvent control of each cell line was calculated. Presented are biological replicates (n = 3) and their means. Statistics were calculated with ANOVA followed by Tukey's post‐test. Shown are the statistics for the comparisons between the cell lines (bottom) as well as the comparisons to solvent control for each cell line (top). (A–I) Bliss synergy scores for the indicated cell lines were calculated from metabolic activity data (0, 10, 20, 40, 100 ng·mL−1 VCR ±0, 0.5, 1, 2 μm afatinib or 0, 1, 10, 1000 nm tariquidar for 48 h in all cell lines) using synergyfinder. A score > 10 (marked with a line) indicates synergy. ***P < 0.001, **P < 0.01, *P < 0.05, ns, not significant.

Acknowledgments
This image is the copyrighted work of the attributed author or publisher, and ZFIN has permission only to display this image to its users. Additional permissions should be obtained from the applicable author or publisher of the image. Full text @ Mol. Oncol.