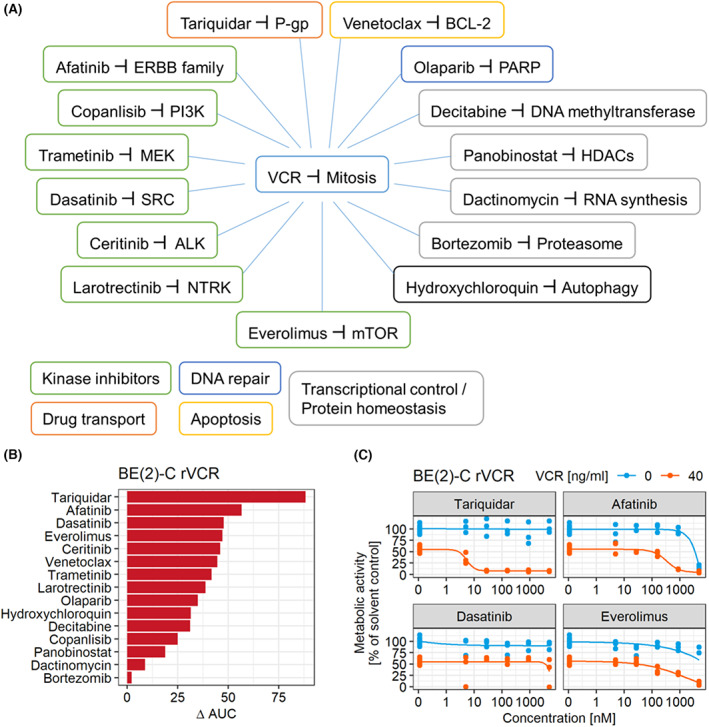
IMAGE

Fig. 1

ID
ZDB-IMAGE-230107-7
Source
Figures for Rösch et al., 2022
Image
Figure Caption

Fig. 1

Functional screen identifies ERBB4 and P‐gp inhibitors to break resistance. (A) Schematic representation of the drugs and their targets. Drug classes are indicated. (B) A metabolic activity screen read‐out (CellTiterGlo) of combination treatment of VCR with 15 anticancer drugs (14 clinically approved) was performed with BE(2)‐C rVCR. The cells were treated with 0, 5, 28, 158, 889, and 5000 nm of the 15 drugs alone or in combination with 40 ng·mL−1 VCR for 48 h. The difference in area under the curve (AUC) between single and combination treatment (ΔAUC) was calculated. The screen was performed in triplicates. (C) Concentration curves of the top four AUC hits (in triplicates) from (B) with (orange) or without (blue) addition of 40 ng·mL−1 VCR.

Acknowledgments
This image is the copyrighted work of the attributed author or publisher, and ZFIN has permission only to display this image to its users. Additional permissions should be obtained from the applicable author or publisher of the image. Full text @ Mol. Oncol.