
- Title
-
Macrophages Rapidly Seal off the Punctured Zebrafish Larval Brain through a Vital Honeycomb Network Structure
- Authors
- Zou, D., Qin, J., Hu, W., Wei, Z., Zhan, Y., He, Y., Zhao, C., Li, L.
- Source
- Full text @ Int. J. Mol. Sci.
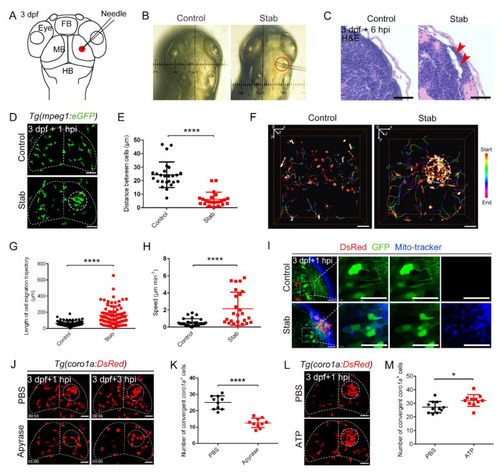
Predominant involvement of macrophages in response to traumatic brain injury caused by stabbing in zebrafish. (A) Stab model. The red dot marks the lesion core (LC). FB, forebrain; MB, midbrain; HB, hindbrain. (B) An actual operation diagram of the stab. The horizontal width of damage was about 130 μm. (C) A paraffin section was stained with hematoxylin and eosin (H&E) staining. The red arrowheads indicate the brain tissue loss. Scale bar, 20 µm. (D) The accumulation of macrophages in Tg(mpeg1:GFP) at 1 hpi. The white dotted line shows the major area of macrophage aggregation. Scale bar, 50 µm. (E) Statistical analysis of the distance between coro1a+ cells in LC. Control, 24.35 ± 1.89 µm n = 25; Stab, 6.14 ± 1.12 µm n = 22. (F) Spatial and temporal migration of macrophages. Scale bar, 50 µm. (G) Length statistics for macrophage migration trajectories. Control, 62.14 ± 3.881 µm, n = 71; Stab, 161.7 ± 13.42 µm, n = 78. (H) Statistical analysis of the movement speed of coro1a-DsRed+ cells after injury. Control, 0.5309 ± 0.08210 µm min−1 n = 28; Stab, 2.148 ± 0.3875 µm min−1 n = 25. (I) MitoTracker signals were detected in the damage sites. The right three panels are the enlarged views of the boxed regions in the left panel. Scale bar, 20 µm. (J) Aggregation of macrophages after apyrase injection in Tg(coro1a:DsRed) embryos at 1 hpi and 3 hpi. Scale bar, 50 µm. (K) Statistical number of coro1a+ cells after injury at 1 hpi. PBS, 25.10 ± 1.303 n = 10; apyrase, 12.60 ± 0.9092 n = 10. (L) Observation of macrophage aggregation after ATP injection at 1 hpi. Scale bar, 50 µm. (M) Statistical number of aggregated coro1a+ cells in (L). PBS, 27.18 ± 1.278 n = 11; ATP, 32.09 ± 1.317 n = 11. (Data are shown as mean ± SEM. *, p < 0.05; ****, p < 0.0001.) |
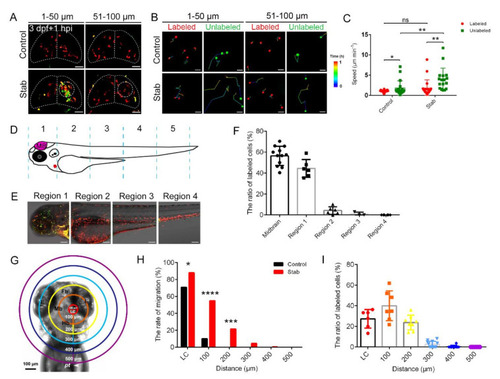
Macrophages around injured regions activated and responded in a distance-dependent manner. (A) The aggregated macrophages did not originate solely from the labeled coro1a-Kaede+ cells in the midbrain. Live imaging on the coro1a-Kaede+ cells in the upper (1–50 µm from surface, left panels) and deep (51–100 µm from surface, right panels) layers of Tg(coro1a:Keade) brains. Scale bar, 50 µm. (B) The migration trajectories of macrophages in different layers. Scale bar, 20 µm. (C) Statistical analysis of migration speed of labeled and unlabeled coro1a-Kaede+ cells. Control, labeled, 1.03 ± 0.05 µm min−1 n = 27; unlabeled, 1.79 ± 0. 42 µm min−1 n = 19; Stab, labeled,1.75 ± 0.46 µm min−1 n = 20; unlabeled, 3.95 ± 0. 68 µm min−1 n = 17. (D) Schematic diagram of regional division of zebrafish body. (E) coro1a+ cells in each region are labeled separately. Scale bar, 100 µm. (F) The proportion of labeled red coro1a-Kaede+ cells from different regions in aggregated cells. (G) Model diagram of region divisions at different distance from the LC. LC is a circle 100 microns in diameter at the lesion core. (H) The rate of migration of labeled cells in each region moving to the LC. (I) The contributing proportion of the cells from different regions to the accumulated macrophages of the honeycomb network configuration. (Data are shown as mean ± SEM. ns, no significance; *, p < 0.05; **, p < 0.01; ***, p < 0.001; ****, p < 0.0001.) |
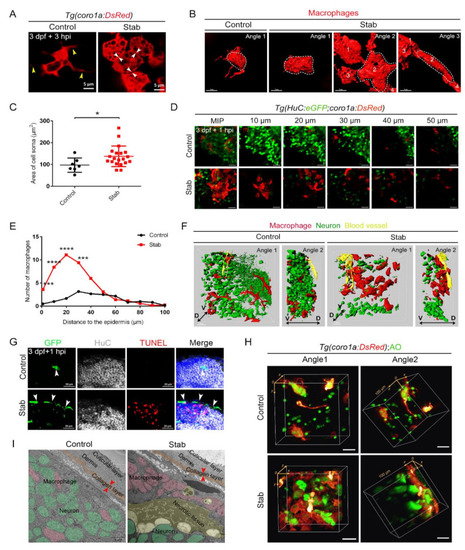
Aggregated macrophages formed a honeycomb network structure covering the wound surface. (A) Changes in macrophages morphology after injury. The yellow arrowheads indicate the branches. The white arrowheads indicate tight connections between cells. Scale bar, 5 µm. (B) Three-dimensional reconstruction of the morphology of macrophages after injury. Angle 1 shows the morphology of individual cells and Angles 2 and 3 indicate tight connections between cells. Scale bar, 7 µm. (C) Statistic analysis of the area of cell soma surface at 3 hpi. Control, 97.08 ± 12.37 µm2 n = 7; Stab, 137.50 ± 10.61 µm2 n = 20. (D) Distribution of macrophages and neurons on different layers of the Z axis at 1 hpi. The number on each panel represents the distances to the surface. Scale bar, 20 µm. (E) Statistics analysis of coro1a+ cells number at different layers with distinct distances from the epidermis at 1 hpi. (F) Three-dimensional images of the distribution of macrophages (red) and neuron (green) in Tg(coro1a:DsRed;HuC:eGFP) at 1 hpi. Yellow marks the blood vessels. D, dorsal; V, ventral. Scale bar, 15 µm. (G) The immunofluorescent images of GFP, HuC and TUNEL on the frozen sections of Tg(coro1a:eGFP) brains at 1 hpi. The white arrowheads present the distribution of GFP+ cells. Scale bar, 20 µm. (H) The location of macrophages and AO+ signals in 3D view. Scale bar, 20 µm. (I) Transmission electron microscope image. Macrophages are in pink, neurons are in green, apoptotic or necrotic tissue is in yellow and the collagen layer beneath the skin is in orange. The red arrowheads indicate the width of the collagen layer. Scale bar, 5 µm. (Data are shown as mean ± SEM. *, p < 0.05; ***, p < 0.001; ****, p < 0.0001.) |
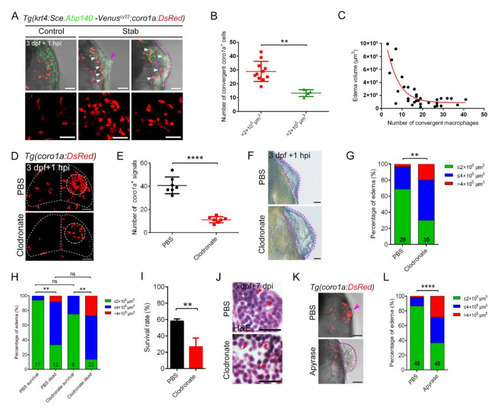
The dense structure of macrophages played an important role in maintaining brain integrity and survival of injured zebrafish larvae. (A) Edematous phenotypes appeared in injured Tg(coro1a:DsRed;krt4:Sce.Abp140-Venus)cy22 with a few macrophage aggregations. The white arrowheads in upper images indicate the distribution of macrophages after injury. Purple arrowhead indicates a mild edematous phenotype. The purple dotted line indicates a severe edematous phenotype. Scale bar, 50 µm. (B) Statistical analysis of aggregated coro1a+ cells number in (A). Control, 28.91 ± 2.19 n = 11; Stab, 13.25 ± 1.25 n = 4. (C) The correlation between edema-like symptoms and the number of aggregated macrophages. (D) The distribution of macrophages after injury with clodronate liposomes or PBS injection. Scale bar, 50 µm. (E) Statistical analysis of aggregated coro1a+ cells in (D). PBS, 40.86 ± 2.72 n = 7; Clodronate, 11.14 ± 0.99 n = 7. (F) Observation of edema-like symptoms after injury. Scale bar, 50 µm. (G) Statistics of edematous symptoms in (F). (H) Analysis of zebrafish survival and edematous symptoms in Clodronate/PBS treatment group after injury. (I) Survival rate of zebrafish at 1 dpi. (J) H&E staining of brain tissue at 7 days after injury. Scale bar, 10 µm. Red arrowheads indicate locations of apparent tissue loss. (K) The bright field and fluorescent images of coro1a-DsRed+ cells and edema-like symptoms by treatment with Apyrase/PBS. Scale bar, 50 µm. Purple arrowhead indicates a mild edematous phenotype. The purple dotted line indicates a severe edematous phenotype. (L) Statistics of edematous symptoms by treatment with apyrase/PBS. (Data are shown as mean ± SEM. ns, no significance; **, p < 0.01; ****, p < 0.0001.) |
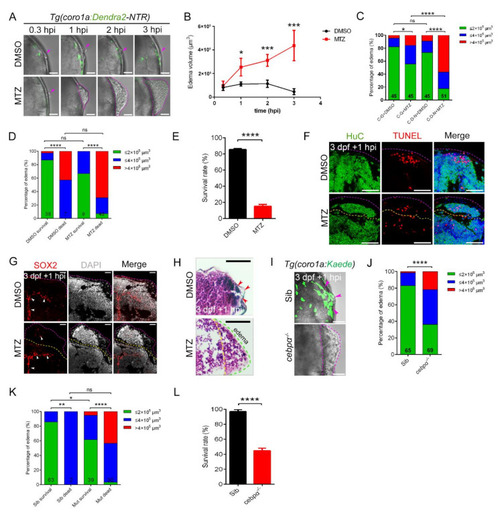
The absence of macrophages led to the development of brain edema. (A) Phenotypes of edema-like symptoms at different time points after injury. Scale bar, 50 µm. (B) Statistics of edema volume in (A). (C) Statistics of edematous symptoms in Tg(coro1a:Dendra2—NTR) (C-D-N) and Tg(coro1a:GFP) (C–G) with DMSO/MTZ treatment. Purple arrowheads indicate the injury sites. (D) Analysis of zebrafish survival and edematous symptoms in Tg(coro1a:Dendra2-NTR) with DMSO/MTZ treatment after injury. (E) Survival rate of Tg(coro1a:Dendra2-NTR) with DMSO/MTZ treatment at 1 dpi. (F) The fluorescent images of HuC+ and TUNEL+ signals in edematous overflow. The purple dotted line represents the lateral edge of the edema and the yellow dotted line represents the internal measurement edge of the edema. Scale bar, 50 µm. (G) The fluorescent images of SOX2+ signals in edematous overflow. The red arrowheads indicate location of SOX2+ signals. Scale bar, 20 µm. (H) Detection of brain tissue by H&E staining of paraffin sections after injury. Red arrowheads indicate the injury site. Scale bar, 50 µm. (I) The bright field and fluorescent images of coro1a-Kaede+ cells and edema-like symptoms (purple dashed line). Scale bar, 50 µm. The purple arrowheads indicate the accumulation of macrophages at the wound site. (J) Statistics of edematous symptoms in cebpα mutant and sibling after injury. (K) Analysis of zebrafish survival and edematous symptoms in cebpα mutant and sibling after injury. (L) Survival rate of cebpα mutant and sibling at 1 dpi. (Data are shown as mean ± SEM. ns, no significance; *, p < 0.05; **, p < 0.01; ***, p < 0.001; ****, p < 0.0001.) |
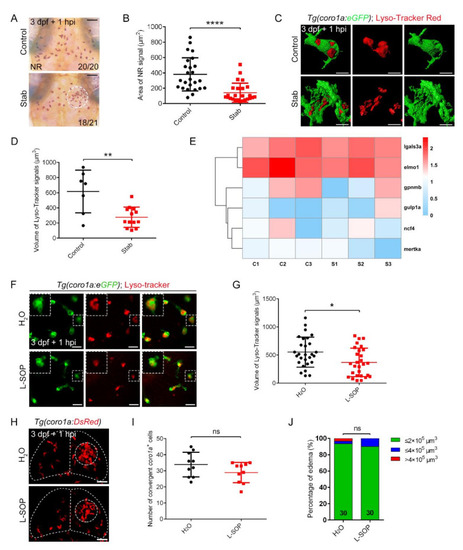
Phagocytosis played limited roles in controlling edematous symptoms. (A) Neutral red staining at 1 hpi. Scale bar, 50 µm. (B) Area statistics of neutral red signals in (A). Control, 381.2 ± 43.43 µm2 n = 25; Stab, 141.8 ± 24.82 µm2 n = 25. (C) The fluorescent images of coro1a-GFP+ and Lyso-Tracker Red+ at 1 hpi. Scale bar, 10 µm. (D) Statistical volume of Lyso-Tracker Red+ signals in (C). Control, 615.60 ± 106.50 µm3, n = 7; Stab, 276.30 ± 36.79 µm3, n = 13. (E) Heat map of phagocytic genes expression. C, control; S, stab. (F) The fluorescent images of coro1a-GFP+ and Lyso-Tracker Red+ after injecting O-phospho-L-serine (L-SOP)/ /H2O. Scale bar, 20 µm. (G) Statistical volume of Lyso-Tracker Red+ signals in (F). H2O, 551.4 ± 50.54 µm3 n = 28; L-SOP, 367.8 ± 47.79 µm3 n = 28. (H) Observation of macrophage aggregation after injecting L-SOP/H2O. Scale bar, 50 µm. (I) Statistical analysis of coro1a+ cells aggregated in (H). H2O, 33.90 ± 2.406 n = 10; L-SOP, 28.90 ± 1.997 n = 10. (J) Statistics of edematous symptoms after the application of L-SOP/H2O. (Data are shown as mean ± SEM. ns, no significance; *, p < 0.05; **, p < 0.01; ****, p < 0.0001). |
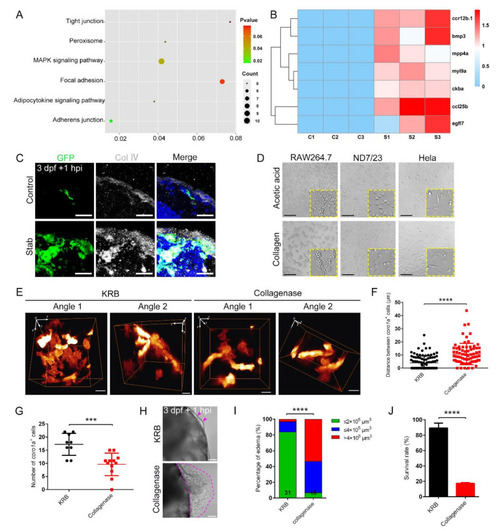
Collagenase disrupted macrophage aggregation and caused severe edematous symptoms. (A) Analysis of the altered signaling pathways in labeled red coro1a-Kaede+ cells before and after injury. (B) Heat map of changed representative genes. (C) Immunofluorescence imaging of GFP and type Ⅳ collagen (Col Ⅳ) on frozen sections of stabbed Tg(coro1a:eGFP) brain. Scale bar, 20 µm. (D) Observation of cell aggregation in the RAW264.7 cell lines, HeLa cell lines and ND7/23 cell lines with collagen/acetic acid added. Scale bar, 100 µm. (E) The distribution of macrophages after collagenase treatment in Tg(coro1a:DsRed) embryos at 1 hpi. KRB, Krebs–Ringer bicarbonate buffer, collagenase solvent. Scale bar, 10 µm. (F) Statistical analysis of distances between the macrophages in (E). KRB, 4.01 ± 0.53 µm n = 96; Collagenase, 10.67 ± 0.94 µm n = 75. (G) Statistical analysis of aggregated coro1a+ cells number in (E). KRB, 17.22 ± 1.40 n = 9; Collagenase, 9.58 ± 1.23 n = 12. (H) Observation of edematous symptoms (purple dished lines) after collagenase/KRB injection. Purple arrowheads indicate a mild edematous phenotype. Scale bar, 50 µm. (I) Statistics of edematous symptoms of the injured larvae after collagenase/KRB injection. (J) Survival rate of the stabbed larvae after collagenase/KRB injection. (Data are shown as mean ± SEM. ***, p < 0.001; ****, p < 0.0001.) |
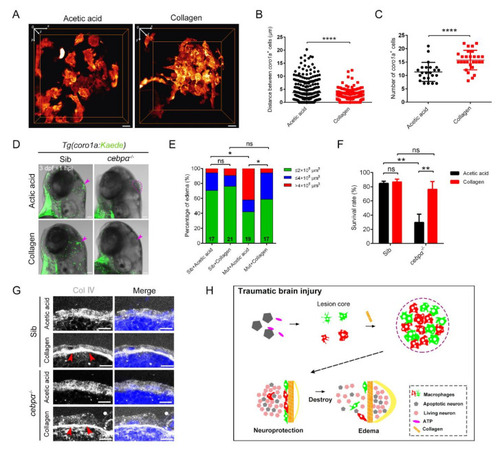
Collagen was crucially involved in the construction of the honeycomb network structure and the protection of brain integrity. (A) The distribution of macrophages after collagen/acetic acid injection in Tg(coro1a:DsRed) embryos at 1 hpi. Scale bar, 10 µm. (B) Statistical analysis of distances between the coro1a-DsRed+ cells in (A). Acetic acid, 3.73 ± 0.21 µm n = 340; collagen, 2.05 ± 0.10 µm n = 351. Acetic acid, collagen solvent. (C) Statistical number of aggregated coro1a+ cells in (A). Acetic acid, 11.30 ± 0.75 n = 23; collagen, 15.75 ± 0.69 n = 28. (D) The bright field and fluorescent images of coro1a-Kaede+ cells and edema-like symptoms (purple arrowheads and dashed line) in sibling and cebpα mutant with collagen/acetic acid injection. Scale bar, 100 µm. (E,F) Statistics of edematous symptoms (E) and survival rate (F) after collagen/acetic acid injection in cebpα mutant and sibling. (G) The immunofluorescence staining of collagen (Col Ⅳ) in cebpα mutant after injection of collagen. Scale bar, 10 µm. Red arrowheads indicate dense collagen layers. (H) Diagram of our results. The rapid and efficient construction of the honeycomb network structure by aggregated macrophages/microglia required nucleotide-mediated migration and collagen supportive tight junctions. The honeycomb network structures played an important role in the integrity of the damaged brain to protect the brain components inside. (Data are shown as mean ± SEM. ns, no significance; *, p < 0.05; **, p < 0.01; ****, p < 0.0001.) |