
Fig. 7
- ID
- ZDB-FIG-220927-71
- Publication
- Zou et al., 2022 - Macrophages Rapidly Seal off the Punctured Zebrafish Larval Brain through a Vital Honeycomb Network Structure
- Other Figures
- All Figure Page
- Back to All Figure Page
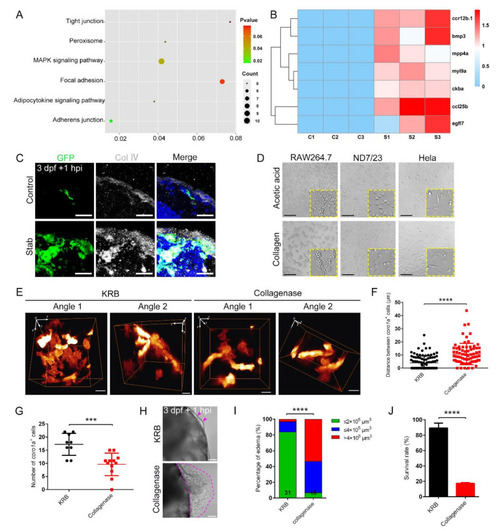
Collagenase disrupted macrophage aggregation and caused severe edematous symptoms. (A) Analysis of the altered signaling pathways in labeled red coro1a-Kaede+ cells before and after injury. (B) Heat map of changed representative genes. (C) Immunofluorescence imaging of GFP and type Ⅳ collagen (Col Ⅳ) on frozen sections of stabbed Tg(coro1a:eGFP) brain. Scale bar, 20 µm. (D) Observation of cell aggregation in the RAW264.7 cell lines, HeLa cell lines and ND7/23 cell lines with collagen/acetic acid added. Scale bar, 100 µm. (E) The distribution of macrophages after collagenase treatment in Tg(coro1a:DsRed) embryos at 1 hpi. KRB, Krebs–Ringer bicarbonate buffer, collagenase solvent. Scale bar, 10 µm. (F) Statistical analysis of distances between the macrophages in (E). KRB, 4.01 ± 0.53 µm n = 96; Collagenase, 10.67 ± 0.94 µm n = 75. (G) Statistical analysis of aggregated coro1a+ cells number in (E). KRB, 17.22 ± 1.40 n = 9; Collagenase, 9.58 ± 1.23 n = 12. (H) Observation of edematous symptoms (purple dished lines) after collagenase/KRB injection. Purple arrowheads indicate a mild edematous phenotype. Scale bar, 50 µm. (I) Statistics of edematous symptoms of the injured larvae after collagenase/KRB injection. (J) Survival rate of the stabbed larvae after collagenase/KRB injection. (Data are shown as mean ± SEM. ***, p < 0.001; ****, p < 0.0001.) |