
Fig. 2
- ID
- ZDB-FIG-220927-66
- Publication
- Zou et al., 2022 - Macrophages Rapidly Seal off the Punctured Zebrafish Larval Brain through a Vital Honeycomb Network Structure
- Other Figures
- All Figure Page
- Back to All Figure Page
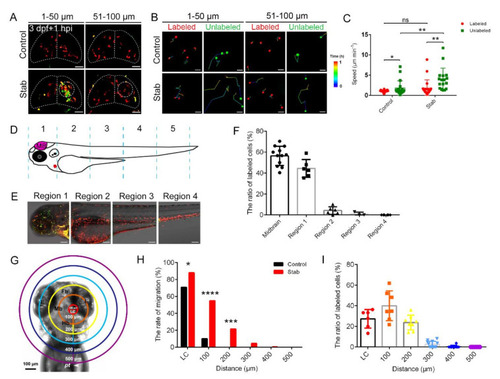
Macrophages around injured regions activated and responded in a distance-dependent manner. (A) The aggregated macrophages did not originate solely from the labeled coro1a-Kaede+ cells in the midbrain. Live imaging on the coro1a-Kaede+ cells in the upper (1–50 µm from surface, left panels) and deep (51–100 µm from surface, right panels) layers of Tg(coro1a:Keade) brains. Scale bar, 50 µm. (B) The migration trajectories of macrophages in different layers. Scale bar, 20 µm. (C) Statistical analysis of migration speed of labeled and unlabeled coro1a-Kaede+ cells. Control, labeled, 1.03 ± 0.05 µm min−1 n = 27; unlabeled, 1.79 ± 0. 42 µm min−1 n = 19; Stab, labeled,1.75 ± 0.46 µm min−1 n = 20; unlabeled, 3.95 ± 0. 68 µm min−1 n = 17. (D) Schematic diagram of regional division of zebrafish body. (E) coro1a+ cells in each region are labeled separately. Scale bar, 100 µm. (F) The proportion of labeled red coro1a-Kaede+ cells from different regions in aggregated cells. (G) Model diagram of region divisions at different distance from the LC. LC is a circle 100 microns in diameter at the lesion core. (H) The rate of migration of labeled cells in each region moving to the LC. (I) The contributing proportion of the cells from different regions to the accumulated macrophages of the honeycomb network configuration. (Data are shown as mean ± SEM. ns, no significance; *, p < 0.05; **, p < 0.01; ***, p < 0.001; ****, p < 0.0001.) |