
|
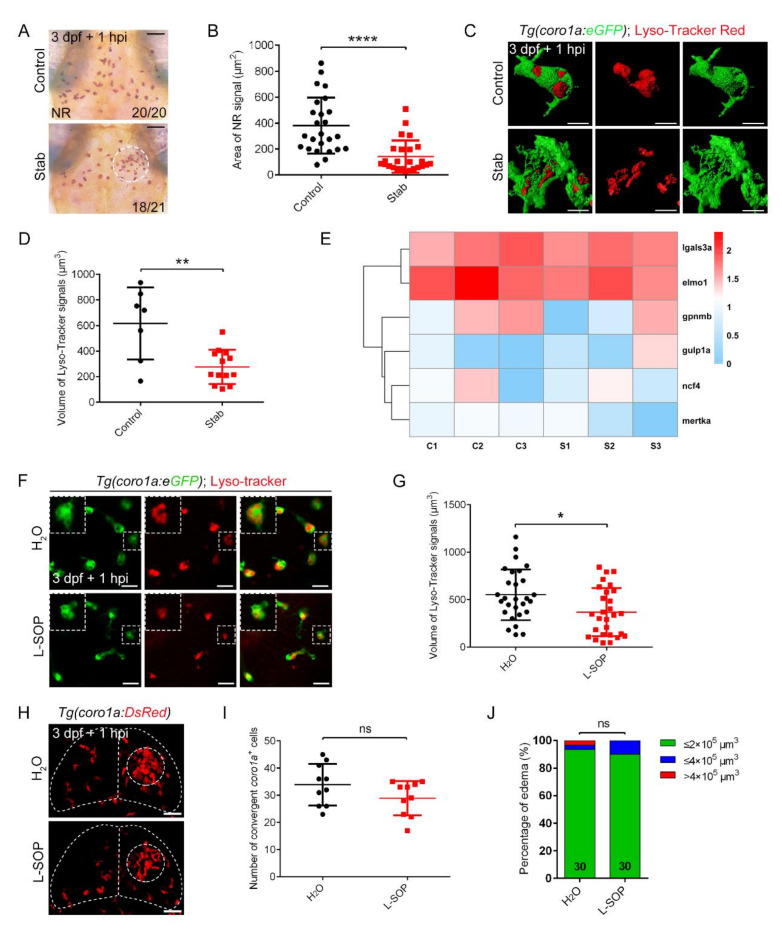
Fig. 6
Phagocytosis played limited roles in controlling edematous symptoms. (A) Neutral red staining at 1 hpi. Scale bar, 50 µm. (B) Area statistics of neutral red signals in (A). Control, 381.2 ± 43.43 µm2 n = 25; Stab, 141.8 ± 24.82 µm2 n = 25. (C) The fluorescent images of coro1a-GFP+ and Lyso-Tracker Red+ at 1 hpi. Scale bar, 10 µm. (D) Statistical volume of Lyso-Tracker Red+ signals in (C). Control, 615.60 ± 106.50 µm3, n = 7; Stab, 276.30 ± 36.79 µm3, n = 13. (E) Heat map of phagocytic genes expression. C, control; S, stab. (F) The fluorescent images of coro1a-GFP+ and Lyso-Tracker Red+ after injecting O-phospho-L-serine (L-SOP)/ /H2O. Scale bar, 20 µm. (G) Statistical volume of Lyso-Tracker Red+ signals in (F). H2O, 551.4 ± 50.54 µm3 n = 28; L-SOP, 367.8 ± 47.79 µm3 n = 28. (H) Observation of macrophage aggregation after injecting L-SOP/H2O. Scale bar, 50 µm. (I) Statistical analysis of coro1a+ cells aggregated in (H). H2O, 33.90 ± 2.406 n = 10; L-SOP, 28.90 ± 1.997 n = 10. (J) Statistics of edematous symptoms after the application of L-SOP/H2O. (Data are shown as mean ± SEM. ns, no significance; *, p < 0.05; **, p < 0.01; ****, p < 0.0001).