
- Title
-
Disruption of grin2B, an ASD-associated gene, produces social deficits in zebrafish
- Authors
- Zoodsma, J.D., Keegan, E.J., Moody, G.R., Bhandiwad, A.A., Napoli, A.J., Burgess, H.A., Wollmuth, L.P., Sirotkin, H.I.
- Source
- Full text @ Mol Autism
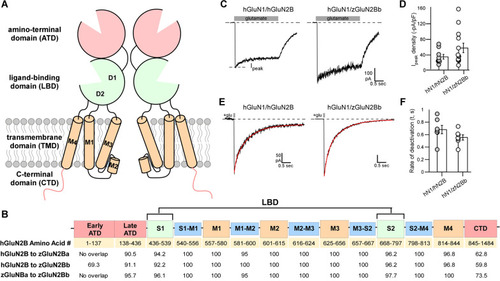
Zebrafish orthologues have a similar sequence and function to human GluN2B (hGluN2B) A Schematic depiction of membrane topology of two NMDAR subunits. Functional NMDARs are tetramers composed of two obligatory GluN1 subunits and typically two GluN2 (A–D) subunits. NMDARs are composed of four modular domains: the extracellular ATD and LBD; the membrane-embedded TMD; and the intracellular CTD. These domains are intrinsic to the full-length receptor as well as individual subunits. Each individual subunit contributes three transmembrane segments (M1, M3, and M4) and a M2 pore loop to form the ion channel. B Linear representation of an NMDAR subunit. Colors match the 3D cartoon in (A) with TMD-associated linkers indicated in blue. The S1 and S2 combine to generate the LBD, which in the 3-dimensional structure is referred to as D1 (mainly composed of S1) and D2 (mainly composed of S2). Table, broken down by NMDAR region, showing the amino acid alignment between hGluN2B and each of the zebrafish GluN2B paralogues (zGluN2Ba and zGluN2Bb). Values indicate percent similarity of amino acids. C Whole-cell currents from HEK 293 cells expressing human GluN1 subunit (hGluN1), with either hGluN2B (hGluN1/hGluN2B) (left panel) or the zGluN2Bb (hGluN1/zGluN2Bb) (right panel) Currents were elicited by a 2.5 s application of glutamate (1 mM, gray bar) in the continuous presence of glycine (0.1 mM). Holding potential, − 70 mV. D Variations in peak current amplitudes between the constructs. Bar graph (mean ± SEM) showing peak current amplitude density (Ipeak/Membrane capacitance). Circles are individual recordings. Number of recordings are 11 and 12 (left to right). E Whole-cell currents in response to brief (2 ms) glutamate applications, as occurs at synapses. F Bar graph (mean ± SEM) showing deactivation rates. Values were not significantly different. Number of recordings are 11 and 12 (left to right) |
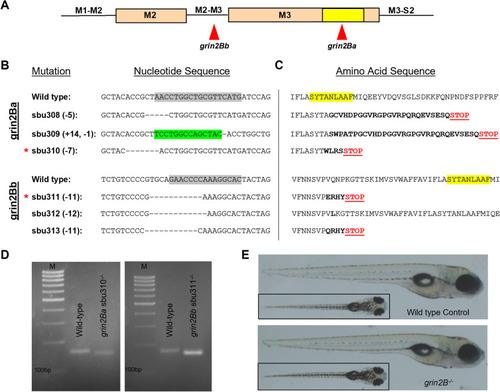
Generation of loss-of-function lesions in grin2Ba and grin2Bb using CRISPR-Cas9. A Linear representation of the M2 and M3 segments indicating gRNA target sites for grin2Ba and grin2Bb. The SYTANLAAF motif (indicated in yellow) is the most highly conserved motif in iGluRs and is fundamental to their function. B and C Alignments of B nucleotide and C amino acid sequences. gRNA target sites on the nucleotide sequence are indicated (gray highlights). Induced mutations within the nucleotide sequences are denoted as either dashes (deletions) or highlighted green (insertions). Altered amino acid sequences (bolded) and early stop codons (Red STOP) are generated in all alleles except sbu312. Such early translation termination events would prevent encoding the SYTANLAAF motif (yellow highlight) as well as the D2 lobe of the LBD, which would make the receptor non-functional. D Only mutant mRNA is detected for each grin2B lesion by rt-PCR. cDNA amplification of: grin2Ba+/+ and grin2Ba−/− (unless otherwise noted, grin2Ba−/− denotes the sbu310 allele) producing expected product sizes of 158 bp and 151 bp, respectively; and grin2Ba+/+ and grin2Bb−/− (unless otherwise noted, grin2Bb−/− denotes the sbu311 allele) producing expected product sizes of 171 bp and 160 bp, respectively. M denotes marker. For all genotypes, RNA was collected from homozygous intercrosses at 5 dpf. E Lateral and dorsal (inlet) images of representative 6 dpf wild type (top) and grin2B−/− (bottom) PHENOTYPE:
|
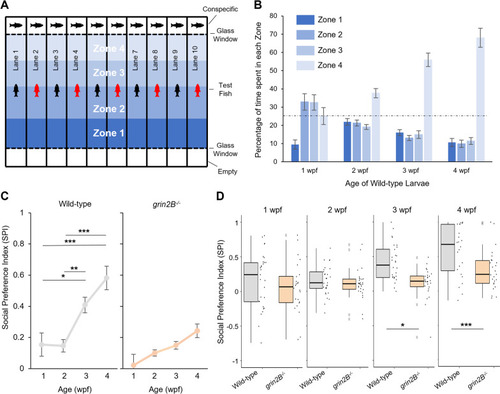
Fish lacking grin2B show a juvenile social deficit. A Schematic depiction of social behavior chamber. Each lane contains a test fish, either a wild-type control (depicted as a black fish) or a grin2B−/− (depicted as a red fish). Individual fish can swim freely the length of the test lane. At the end of each lane is a clear glass window that is either empty (bottom row) or contains a wild-type age-matched conspecific (upper row) behind it. Each lane is subdivided into four equally sized zones, with Zone 4 the closest to the conspecific. B Bar graph (mean ± SEM) illustrating the time spent in each of the 4 zone subdivisions for either wild type at 1 (n = 29), 2 (n = 29), 3 (n = 28), or 4 (n = 24) wpf (weeks post fertilization). After allowing fish to briefly acclimate in the lane, fish were measured for 20 min. Dashed line is at 25%, the value of no preference for any zone. C Social Preference Index (SPI) (see “Materials and methods” section), a metric for social affinity. Values closer to 1 indicate a stronger social preference while 0 indicates no social preference. SPI was calculated at successive weeks for the experiment outlined in (A, B). Fish were assayed weekly from 1 to 4 wpf with experimental details in Additional file 1: Table S1. D Boxplots showing pairwise comparison of SPI for the same wild-type and grin2B−/− fish at 1–4 wpf outlined in panel C. Individual dots represent SPI for individual fish with experimental details in Additional file 1: Table S1 PHENOTYPE:
|
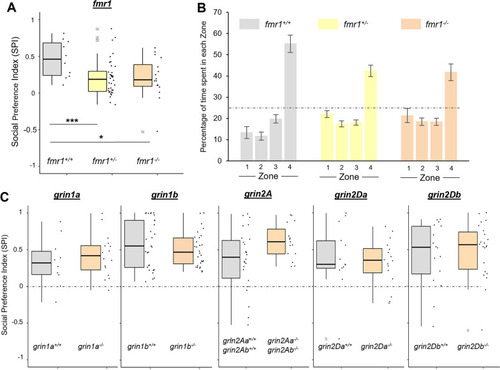
Zebrafish lacking fmr1, but not other NMDAR subunits, show a social preference deficit at 3 wpf. A SPI from a 3 wpf assay on fish lacking fmr1. Experimental details in Additional file 1: Table S4. B Bar graph (mean ± SEM) outlining mean time spent in each of the zone subdivisions for each fmr1 genotype at 3 wpf. Dashed line is at 25%, the value of no preference for any zone. Zone 4 is the region closest to the conspecific. C SPI from 3 wpf assays of zebrafish lacking grin1a, grin1b, grin2A, grin2Da, and grin2Db. Dashed line is at 0, the value of no preference in SPI. Experimental details in Additional file 1: Table S4 PHENOTYPE:
|
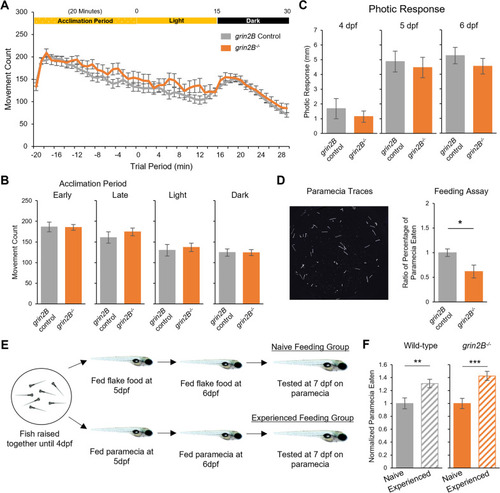
Zebrafish larvae lacking grin2B have wild-type spontaneous and photic-evoked swim behaviors and show the capacity to learn prey capture. A Spontaneous and photic-evoked larval swim behavior assay. Zebrafish larvae at 6 dpf acclimate to a behavior chamber for 20 min in the light and then are recorded for 15 min of spontaneous movement; after the removal of illumination, 15 min of behavior is measured in the dark. Line graph showing average movement count for a grin2B control (n = 70) and the grin2B−/− fish (n = 30). Both control and mutant larvae exhibited the stereotypical visual motor response (VMR). B Bar graphs (mean ± SEM) of average movement count in each time period of the spontaneous and photic-evoked behavior outlined in (A). No differences were seen in any time period. C Zebrafish respond with a stereotyped startle response to the removal of illumination. Bar graphs showing the average distance traveled for a grin2B control (n = 19, 22, 22) and the grin2B−/− fish (n = 27, 31, 31) for 4, 5, and 6 dpf, respectively, in the 1 s time period immediately following the removal of illumination. No difference was seen in the average response between groups at 4, 5, or 6 dpf. D Representative traces of paramecium movement used in feeding assay. Traces generated by analyzing 2.5 s of paramecia movement. Proportion of paramecia eaten over the trial period (mean ± SEM) normalized to control for: grin2B Control (n = 51) or grin2B−/− (n = 20) fish at 7 dpf (*p = 0.011, t test). E Schematic of larval prey capture learning assay. F Proportion of paramecia eaten (mean ± SEM) in wild-type (left) (n = 35, 35. p = 0.005**, t test) and grin2B−/− (n = 35, 32. p = 1.4e−4***, t test) for naïve (solid bars) and experienced (striped bars) fish, respectively. Proportion of paramecia eaten is normalized to the naïve feeding group |
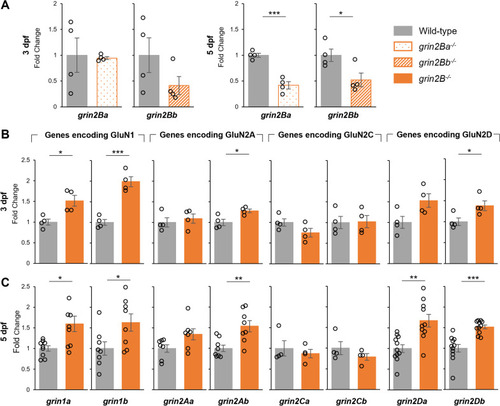
Nonsense-mediated decay and compensatory changes in NMDAR subunit expression in grin2B−/−. A Relative rt-qPCR expression levels at grin2Ba at 3 dpf (n = 4, 4) and 5 dpf (n = 4, 4; ***p = 3.5e−4) for wild-type controls and grin2Ba single mutants, respectively, and of grin2Bb at 3 dpf (n = 4, 4) and 5 dpf (n = 4, 4; *p = 0.037) for wild-type controls and grin2Bb single mutants, respectively. B Relative rt-qPCR expression levels at 3 dpf of grin1a (n = 4, 4; *p = 0.013), grin1b (n = 4, 4; ***p = 9.4e−4), grin2Aa (n = 4, 4), grin2Ab (n = 4, 4; *p = 0.026), grinCa (n = 4, 4), grinCb (n = 4, 4), grinDa (n = 4, 4), and grinDb (n = 4, 4; *p = 0.041) for wild type and grin2B−/−, respectively. C Relative rt-qPCR expression levels at 3 dpf of grin1a (n = 9, 9; *p = 0.013), grin1b (n = 8, 8; *p = 0.033), grin2Aa (n = 7, 7), grin2Ab (n = 8, 8; **p = 0.0061), grinCa (n = 4, 4), grinCb (n = 4, 4), grinDa (n = 11, 10; **p = 0.0018), and grinDb (n = 11, 11; ***p = 1.5e−4) for wild type and grin2B−/−, respectively EXPRESSION / LABELING:
PHENOTYPE:
|
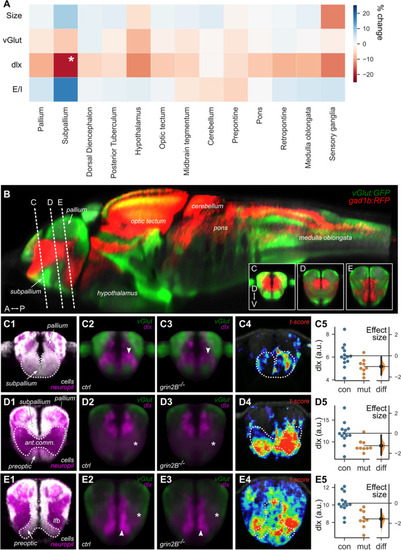
Whole-brain imaging of zebrafish lacking GluN2B reveal a reduced inhibitory neuron signal in the subpallium. A Heat map of the ratio of size, transgenic expression of excitatory (vGlut) and inhibitory (dlx) marker, and calculated excitatory/inhibitory balance (E/I) for grin2B control (n = 13) and grin2B−/− (n = 9) larvae. Values are shown as the percent increase in the signal grin2B−/− larvae compared to grin2B control. (*p = 0.022, independent-samples t test). B Reconstructed sagittal section from the Zebrafish Brain Browser (ZBB) showing the distribution of glutamatergic (green) and GABAergic (red) neurons in the larval brain. Planes through which coronal sections were reconstructed for panels C–E are indicated. Anterior (A), posterior (P), dorsal (D), ventral (V). In Panel B, C1, D1, and E1 were generated using the Zebrafish Brain Browser. Subpanels 2–4 from (C–E) were generated using data acquired from dlx:GFP larvae. C–E Coronal sections through parts of the subpallium, including the anterior cell-rich domain (C), anterior commissure (D), and preoptic region (E). Subpanel 1: distribution of cell-rich (white) and neuropil-rich (magenta) zones (ZBB). Subpanels 2–3: mean confocal signal in grin2B control and grin2B−/− larvae, for excitatory (Tg(vglut:DsRed); green) and inhibitory (Tg(dlx6a-1.4kbdlx5a/dlx6a:GFP); magenta) neurons. Subpanel 4: spatial locations of voxel-level normalized differences (t-score) between the inhibitory signal in grin2B control and grin2B−/− larvae. Subpanel 5: Estimation plots showing mean intensity of the inhibitory signal per fish, for regions encompassing the anterior subpallium (C, p = 0.015), anterior commissure (D, p = 0.0038), and preoptic region (E, p = 0.0011) for grin2B control (blue) and grin2B−/− (orange) larvae. Right axes show effect sizes for differences |